Precious Metals
May 25, 2026
1 min
Precious Metals
The following content is sponsored by Outcrop Silver

Key takeaways
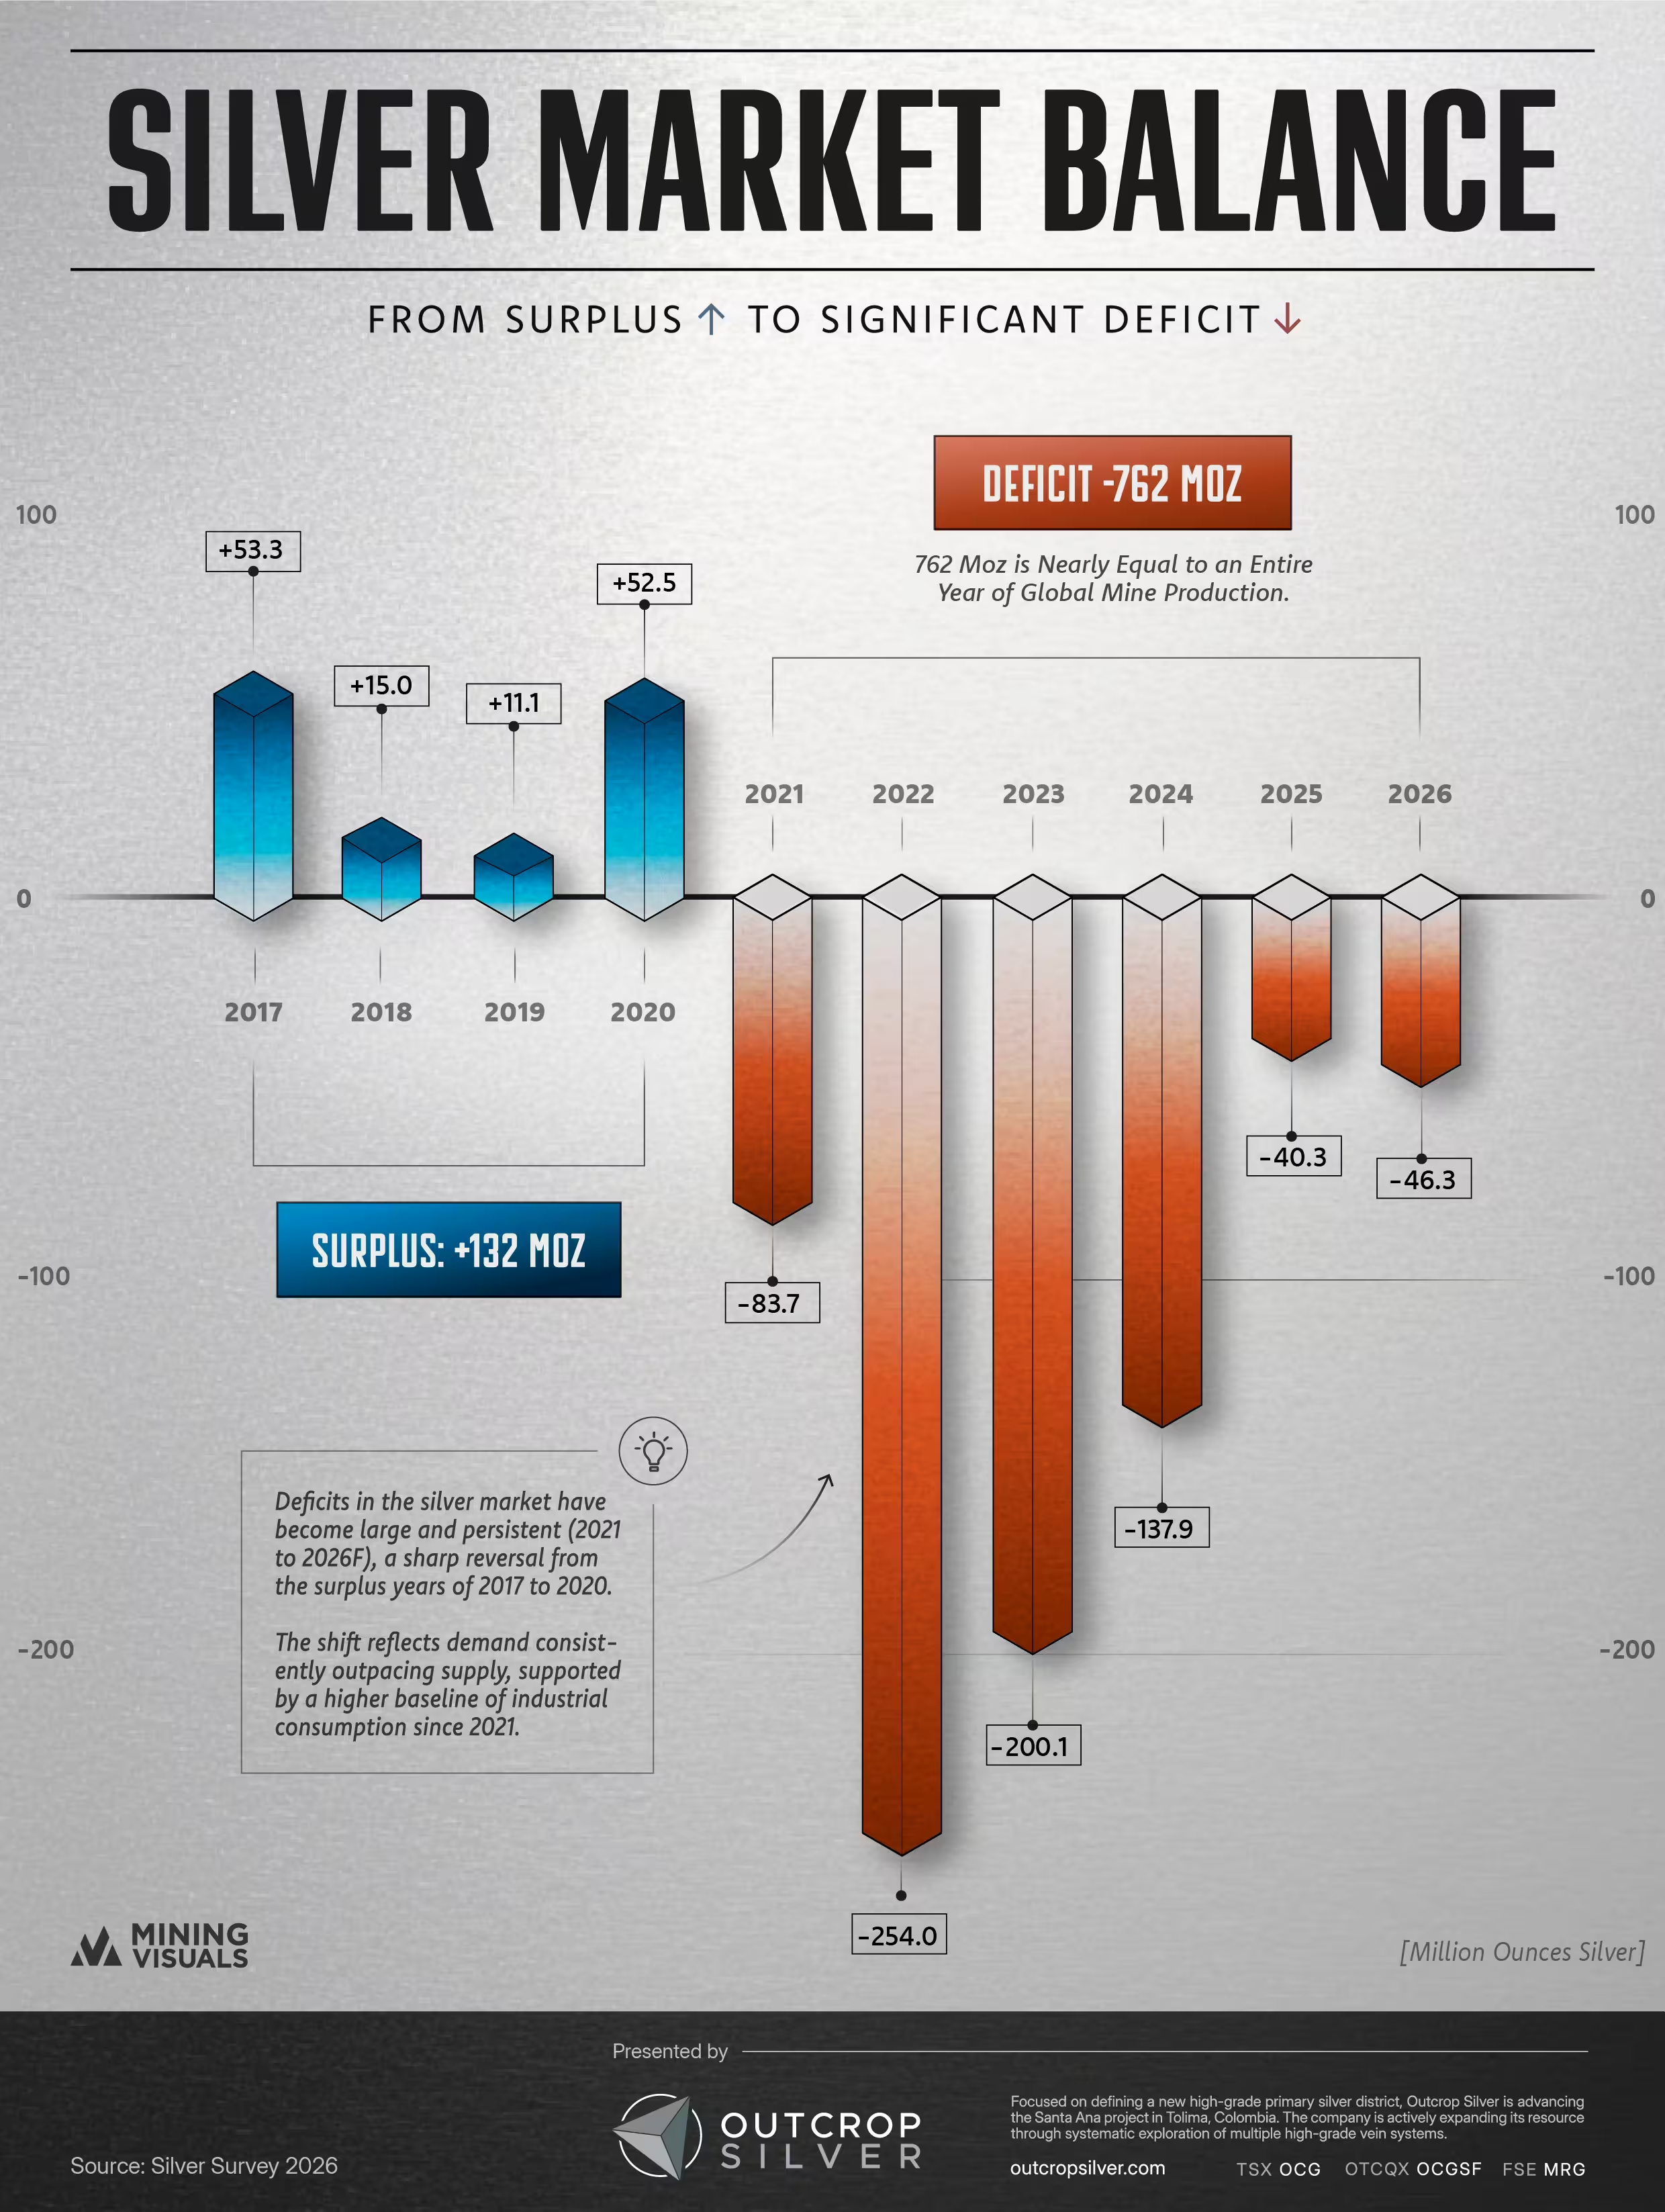
- The silver market ran an annual deficit of 40.3Moz in 2025, the fifth consecutive year that demand exceeded supply, according to the World Silver Survey 2026.
- The survey forecasts a sixth straight deficit in 2026, widening to 46.3Moz, with mine production expected to stay roughly flat.
- The report puts the cumulative drawdown from above-ground stocks at 762.1Moz since 2021, which is why a modest annual gap is straining physical supply.
For the fifth year running, the world used more silver than it produced in 2025, and the World Silver Survey 2026 expects 2026 to extend that streak to six. The report, released in April by the Silver Institute and researched by the London consultancy Metals Focus, pegs the 2025 deficit at 40.3 million ounces and forecasts a wider gap of 46.3 million ounces this year. Each shortfall draws on above-ground stocks, leaving less metal readily available even as total inventories have held up. The survey attributes last year's record-breaking price run to a mix of that tight physical supply, strong investment demand, and a supportive macro backdrop. With silver now trading well off its January high, the question for 2026 is whether that tightness holds.
Five years down, a sixth on the way
The deficit is the through-line of this year's survey. The Silver Institute's review of 2025 records it as the fifth consecutive year that total demand ran ahead of total supply. The annual gap of 40.3Moz was actually narrower than the year before, because high prices pulled in more metal: mine production rose 3% to 846.6Moz, and recycling climbed to a 12-year high of 197.6Moz, while demand eased 2% to 1.13 billion ounces.
That supply response is not expected to repeat. Metals Focus sees mine production holding roughly flat in 2026 and the annual deficit widening to 46.3Moz, which would be the sixth shortfall in a row. When we charted this series last year on the 2025 survey's data, the record showed five straight deficits stretching back to a surplus-to-deficit flip in 2021. This year's report confirms that fifth shortfall and pushes the forecast to a sixth, which keeps the deficit a relatively young but now firmly entrenched feature of the market.
Why a small annual gap still matters
Set against roughly 1.1 billion ounces of yearly demand, a 40 to 46Moz deficit reads as a rounding error. The survey's point is about accumulation rather than any single year. Every deficit removes net metal from the pool of available silver, and the report tallies that running drawdown at 762.1 million ounces since 2021. A narrower deficit slows the drain. It does not put metal back.
The pressure shows up less in the total inventory count than in how much of it is actually free to trade. Total identifiable stocks rose in 2025, but a growing share sat locked inside exchange-traded products or in exchange vaults rather than circulating in London. According to the survey, that thinning of available metal is what turned an otherwise ordinary year into a stress event. In October 2025, falling free-float inventories, a shift of metal into CME vaults, rising holdings in exchange-traded products, and a jump in physical demand pushed London lease rates sharply higher, in what the report calls an unprecedented liquidity squeeze.
Where demand fell, and where it held
Total demand slipped in 2025, yet the market stayed in deficit because the losses landed in the segments most sensitive to price. The survey's figures show industrial demand down 3% to 657.4Moz, as solar manufacturers thrifted and substituted away from silver faster than gains from AI infrastructure, autos, and power-grid spending could offset. Jewelry fell 8%, with India down 20%, and silverware dropped 21%. Working the other way was investment, where coin and net bar demand rose 14%, a recovery we looked at in more detail in a separate piece.
What the 2026 forecast depends on
The survey's sixth-deficit call rests on a fairly specific set of assumptions: flat mine supply, more price-driven weakness in jewelry, silverware, and solar, and investment demand holding up well enough to keep consumption above production. The report is careful to frame its constructive view as conditional, citing a contained geopolitical backdrop and the chance that recent pressure from rising US rate expectations proves temporary. It stops short of a formal price forecast.
Sponsored by:

Outcrop Silver is a leading explorer and developer focused on advancing its flagship Santa Ana high-grade silver project in Colombia. Leveraging a disciplined and seasoned team of professionals with decades of experience in the region. Outcrop Silver is dedicated to expanding current mineral resources through strategic exploration initiatives.
At the core of our operations is a commitment to responsible mining practices and community engagement, underscoring our approach to sustainable development. Our expertise in navigating complex geological and market conditions enables us to consistently identify and capitalize on opportunities to enhance shareholder value.
With a deep understanding of the Colombian mining landscape and a track record of successful exploration, Outcrop Silver is poised to transform the Santa Ana project into a significant silver producer, contributing positively to the local economy and setting new standards in the mining industry.
Learn more about Outcrop Silver at https://outcropsilver.com/
Forward-Looking Statements: This article contains forward-looking information, including 2026 supply, demand, and market-balance projections attributed to Metals Focus and the Silver Institute. Forward-looking statements are based on assumptions and are subject to known and unknown risks and uncertainties, and actual results may differ materially from those projected. All figures are sourced from the World Silver Survey 2026 and the Silver Institute's accompanying public releases and are presented for informational purposes only. Neither MiningVisuals nor the sponsor undertakes any obligation to update forward-looking information.
MiningVisuals Disclaimer: This article is for informational purposes only and does not constitute financial, investment, tax, or legal advice, nor an offer or solicitation to buy or sell any security or commodity. Always conduct your own research and consult a qualified advisor. The views and data presented are those of the World Silver Survey 2026 and its publishers and do not necessarily reflect those of the sponsor.
Sources: World Silver Survey 2026, Silver Institute / Metals Focus (April 15, 2026) · Silver Institute 2026 market outlook (February 10, 2026) · MiningVisuals, Key Takeaways from the 2025 World Silver Survey · MiningVisuals, Charted: Silver Supply and Demand 2016 to 2025F





Explore More
View All


Central Banks Have Been Net Gold Buyers Since 2010, After Two Decades of Net Selling
Central Banks Have Been Net Gold Buyers Since 2010, After Two Decades of Net Selling
Central banks bought more gold between April and June 2026 than in any second quarter on record, according to a World Gold Council report published on July 30. That keeps them net buyers this year, as they have been every year since 2010. Underneath, the picture is changing. Russia and Türkiye, both big buyers in the past, have been selling.

Gold Mines in West Africa: Two Billion Years in the Making
Gold Mines in West Africa: Two Billion Years in the Making
The nine West African countries with significant reported output produced about 15% of the world's mined gold in 2025, according to Metals Focus and World Gold Council data. Almost every mine on the map above was built in the past 25 years, and four more reached production in the last eighteen months: Lafigué in Côte d'Ivoire in June 2024, Kiaka in Burkina Faso in June 2025, Ahafo North in Ghana in October 2025 and Kiniero in Guinea in December 2025.
A Median New US Home Now Costs Less Than 100 Ounces of Gold
A Median New US Home Now Costs Less Than 100 Ounces of Gold
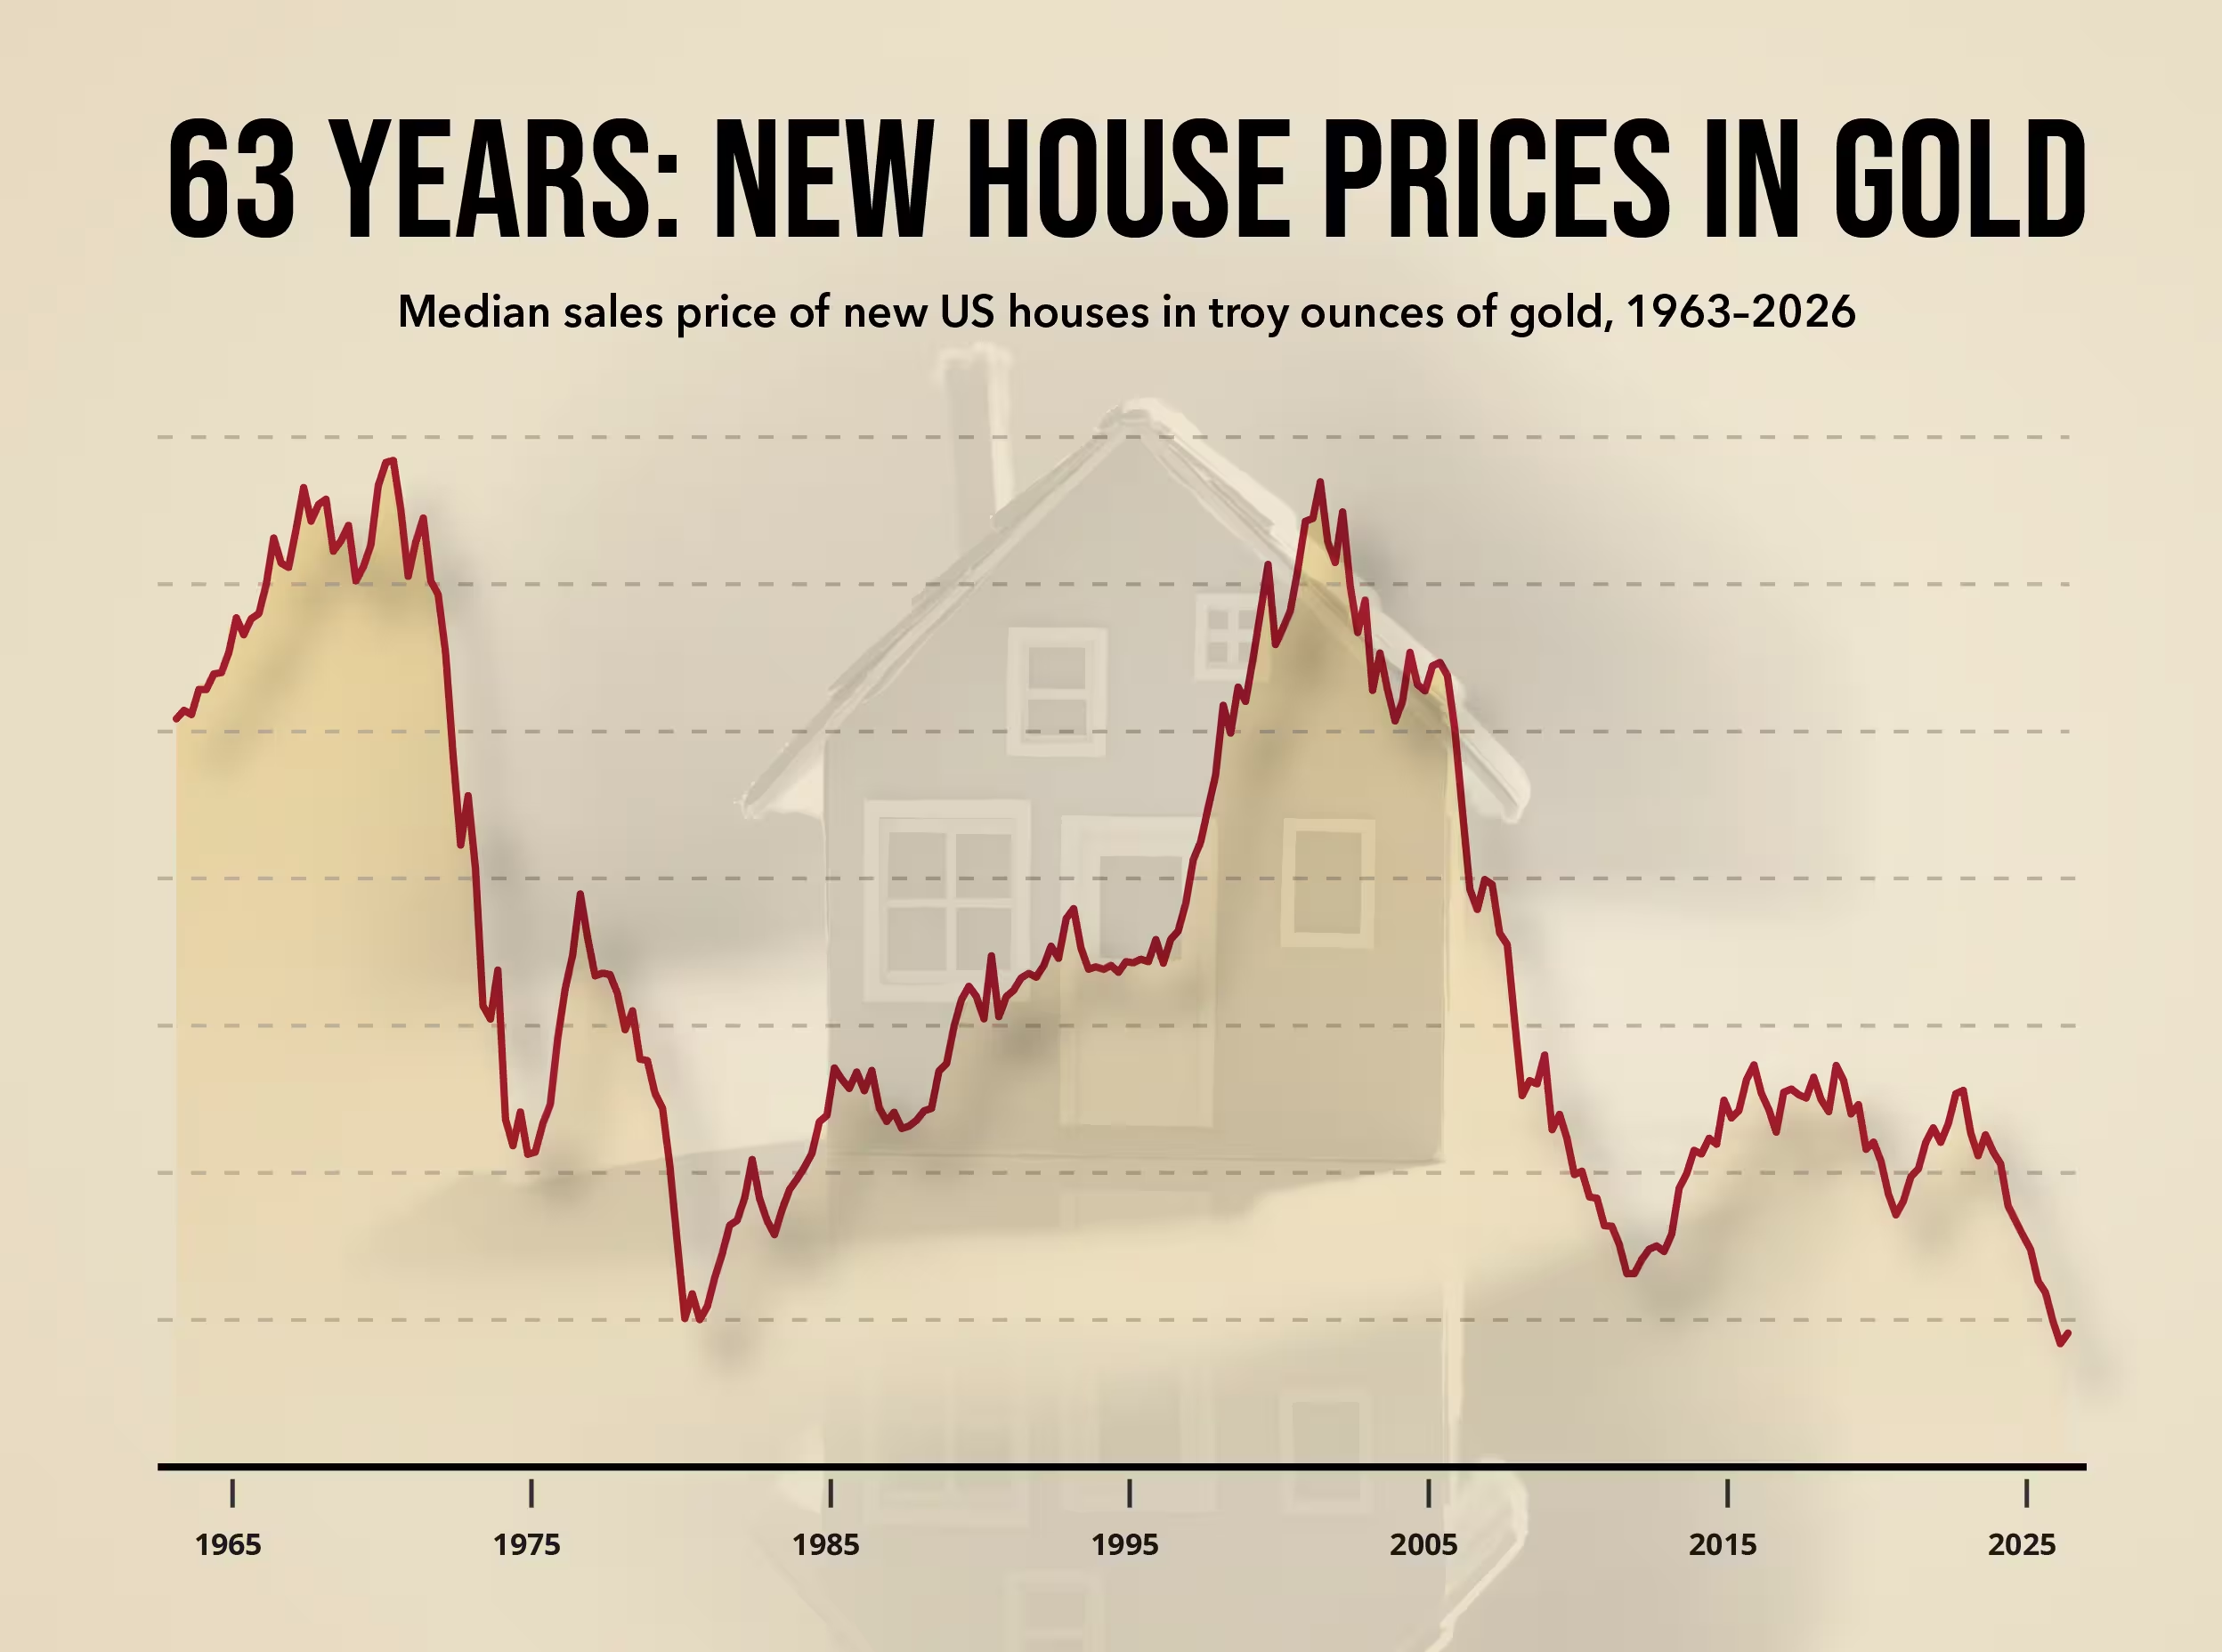
The US Census Bureau's July new-home report, released on August 25, put the median price of a newly built house at $393,800. HousingWire noted that was the lowest since July 2021. In dollars, the market has moved within a narrow band: the quarterly median has stayed between $408,500 and $435,400 since 2023.
Gold's Record Run Has Set Off a Wave of Mining Mergers
Gold's Record Run Has Set Off a Wave of Mining Mergers
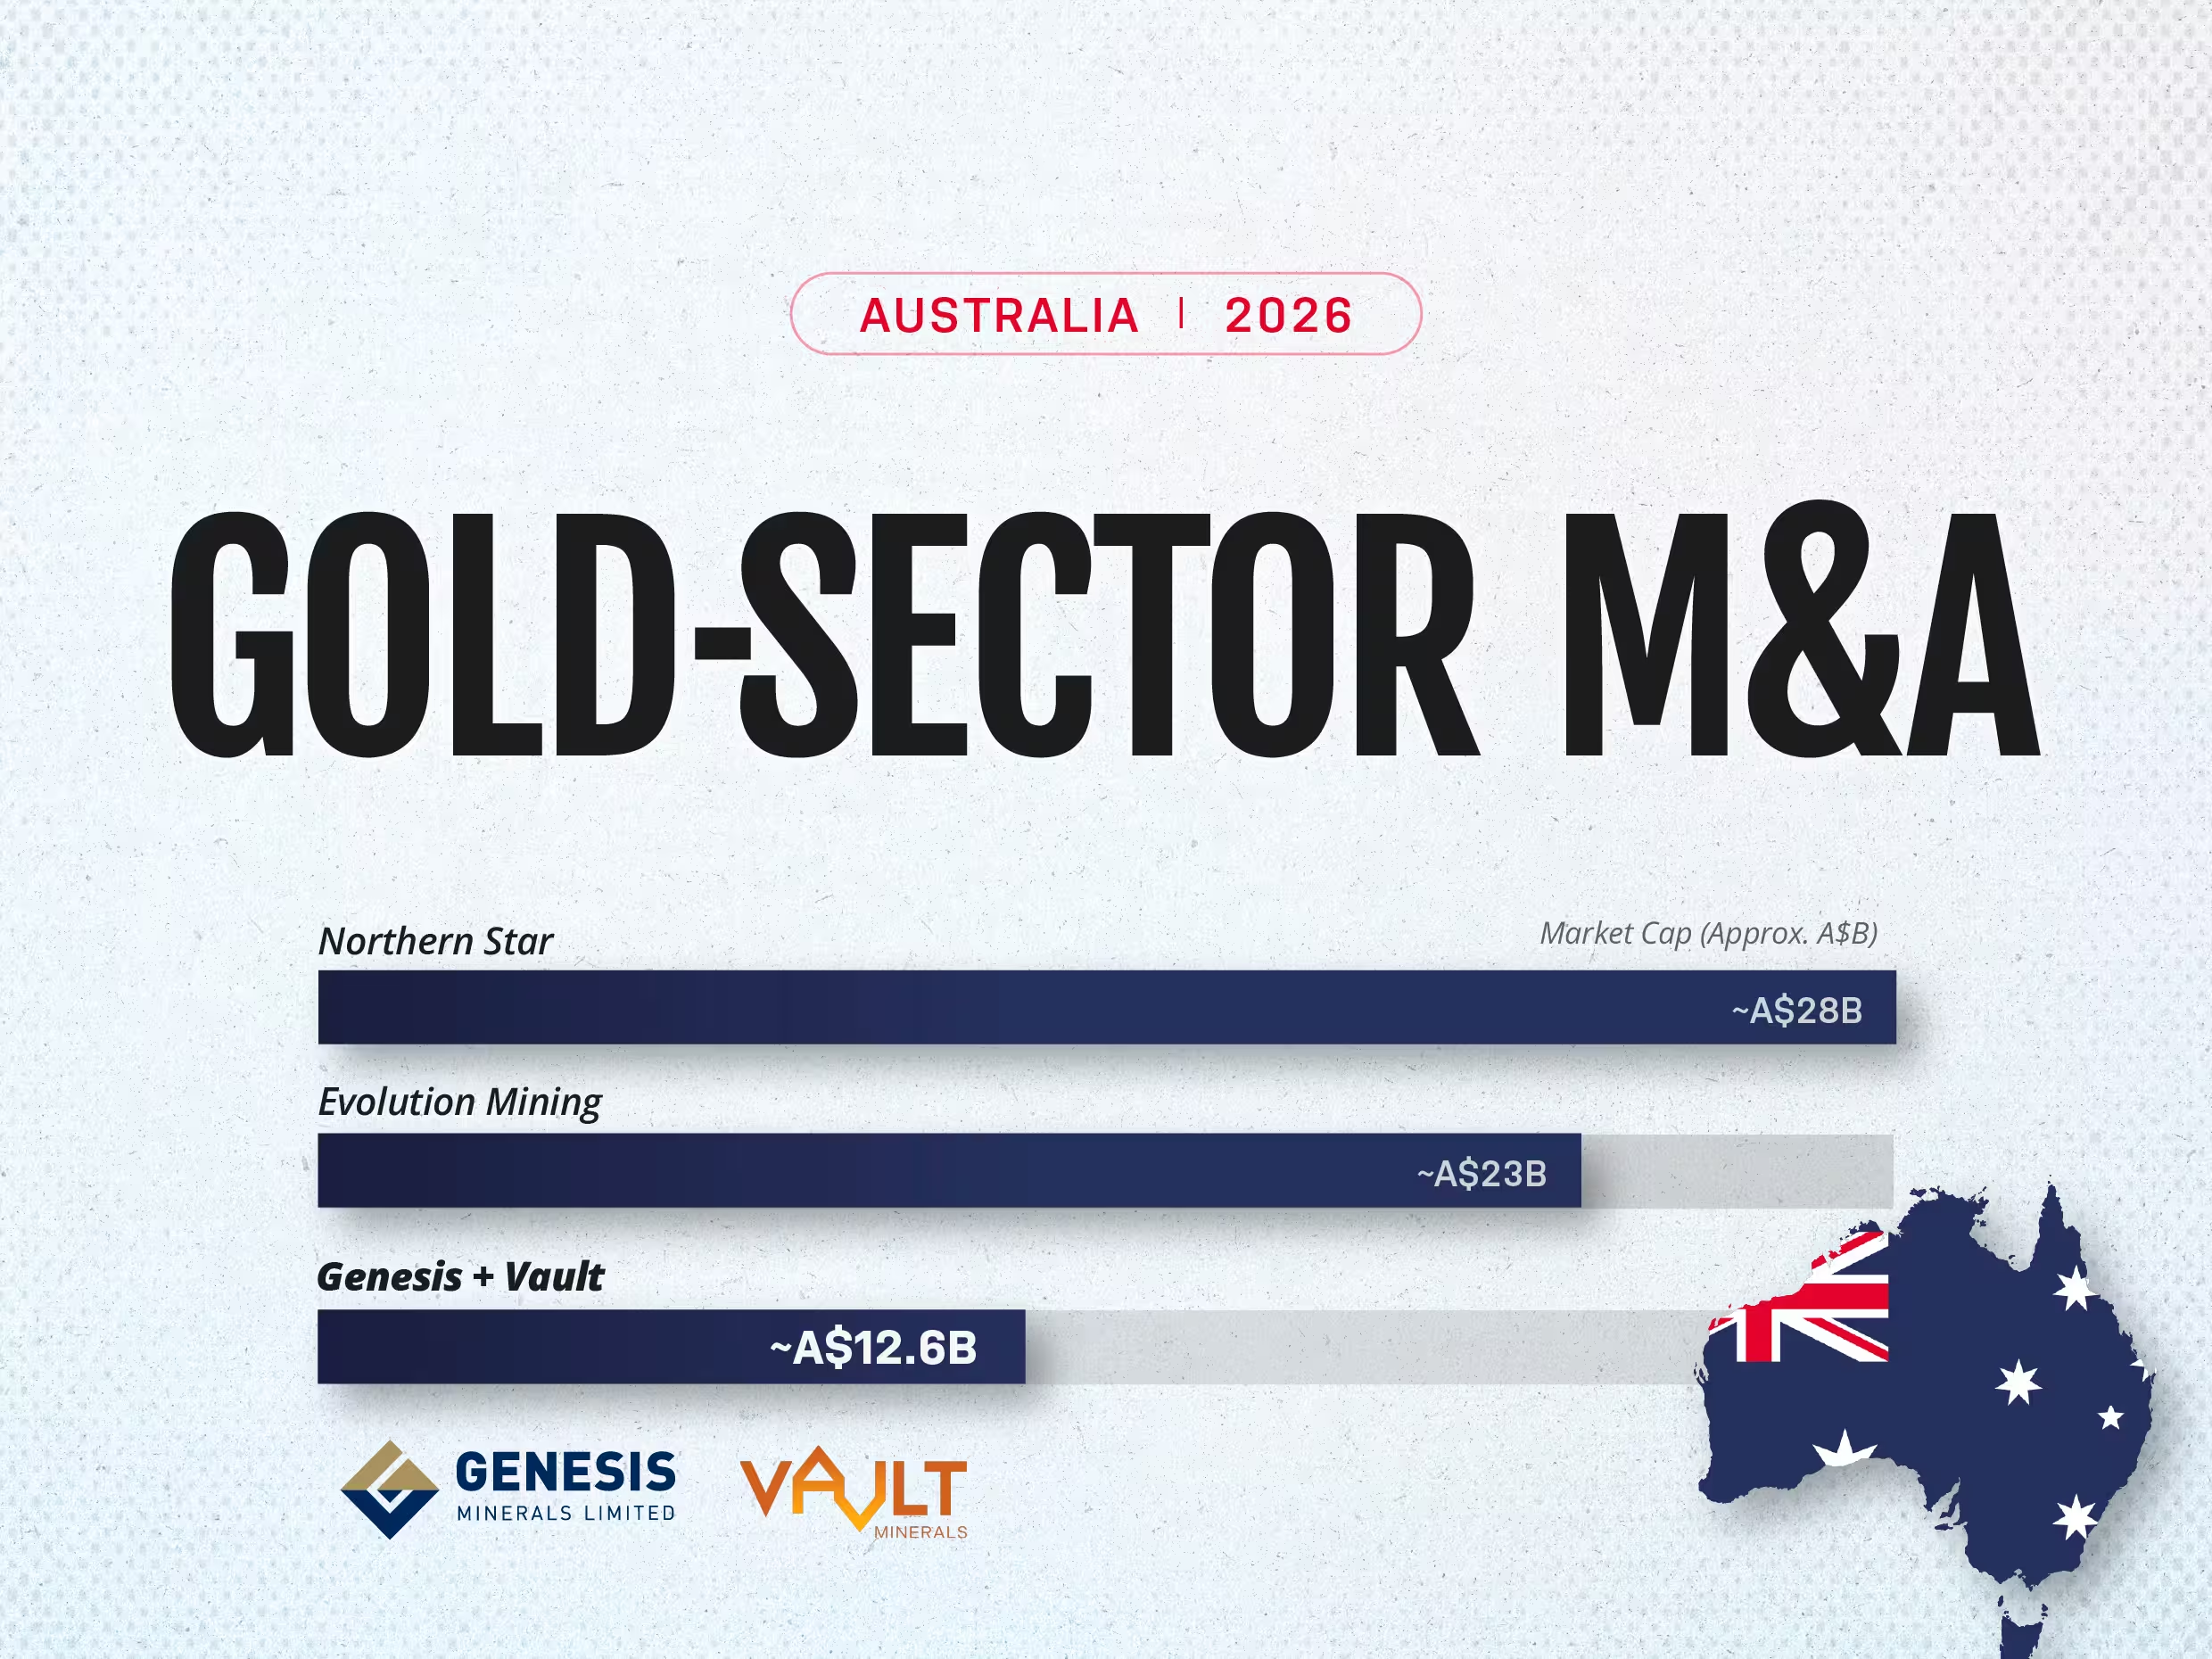
Gold hit an all-time high of about US$5,595 an ounce in January 2026 before settling near US$4,000, still far above the levels of a few years ago. That combination, record prices followed by a stable, still-profitable pullback, has done something a straight rally rarely does: it has opened a merger window.