Copper
Which Metal Drove Each Swing in the Copper-to-Gold Ratio Since 1972
THE 2026 LOW HAD A DIFFERENT CAUSE FROM THE 2009 LOW, WORLD BANK DATA SHOW


Gold Rose 609% as Copper Fell: From November 1973 to September 1980, World Bank monthly averages show gold up 609% and copper down 9%.
Copper's Turn From 1980 to 2006: Copper then rose 264% over 26 years as gold slipped 13%, lifting the ratio more than fourfold, per the same data.
A Rebound Led by Gold: The ratio is up 30% from its February 2026 low as gold fell 14% and copper rose 12%, World Bank prices show.
Gold has spent the autumn well below its early-2026 highs. On November 10 it slid nearly 3% toward $4,000 an ounce after a hotter-than-expected US inflation report, writes Saxo's head of commodity strategy, Ole Hansen.
Copper has held near its record. Its September monthly average of $14,474 a tonne was the highest in World Bank data going back to 1960, while gold's averaged 14% below its February level. The ratio is traditionally read as growth against safety, so a rise is usually taken as a sign of improving economic expectations, Hansen notes.
Between the chart's turning points, World Bank monthly averages show one metal usually doing most of the work. From the November 1973 peak to the September 1980 low, gold rose 609% while copper fell 9%, taking the ratio down 87%. From there to the October 2006 peak, copper rose 264% as gold slipped 13%, lifting the ratio more than fourfold.
The fall from 2006 to early 2009 was the stretch where both metals pushed the same way. Copper's monthly average fell 56% and gold's rose 61%, and the ratio lost 73% in a little over two years.
In February 2009, 1,000 pounds of copper matched 1.59 ounces of gold. That low came from copper, whose monthly average fell 63% between July and December 2008, from $8,414 to $3,072 a tonne.
The February 2026 low of 1.17 ounces, the lowest in a series that starts in 1960, came with copper at $12,951 a tonne, its second-highest monthly average on record at the time. Gold had risen 5.3-fold since February 2009, against 3.9-fold for copper. Hansen separates the two cases: copper collapsing while gold rallies is the classic recession signal, while both metals rising with gold rising faster describes a different setting.
From the February low to September, the ratio rose 30%, to 1.52 ounces. Gold's fall from $5,020 to $4,319 an ounce did more of that work than copper's rise from $12,951 to $14,474 a tonne, according to the World Bank's October Pink Sheet and its monthly history.
Hansen is reluctant to read such a rebound as a growth signal. He describes the ratio as increasingly a contest between copper's physical scarcity and gold's role as a hedge against monetary, fiscal and geopolitical risk, which makes it "less useful as a mechanical forecasting tool." Central banks bought an estimated 321 tonnes of gold in the third quarter, up 42% year on year, according to World Gold Council figures cited by Saxo, extending the buying our October article traced back to 2010.
After a hotter-than-expected October inflation report, markets fully priced in three Federal Reserve rate hikes by next June, Saxo reports. The Fed's next decision is due on December 9, and November inflation data follow a day later, on December 10.
MiningVisuals Disclaimer: This article is for informational purposes only and does not constitute financial or investment advice. Always conduct your own research.


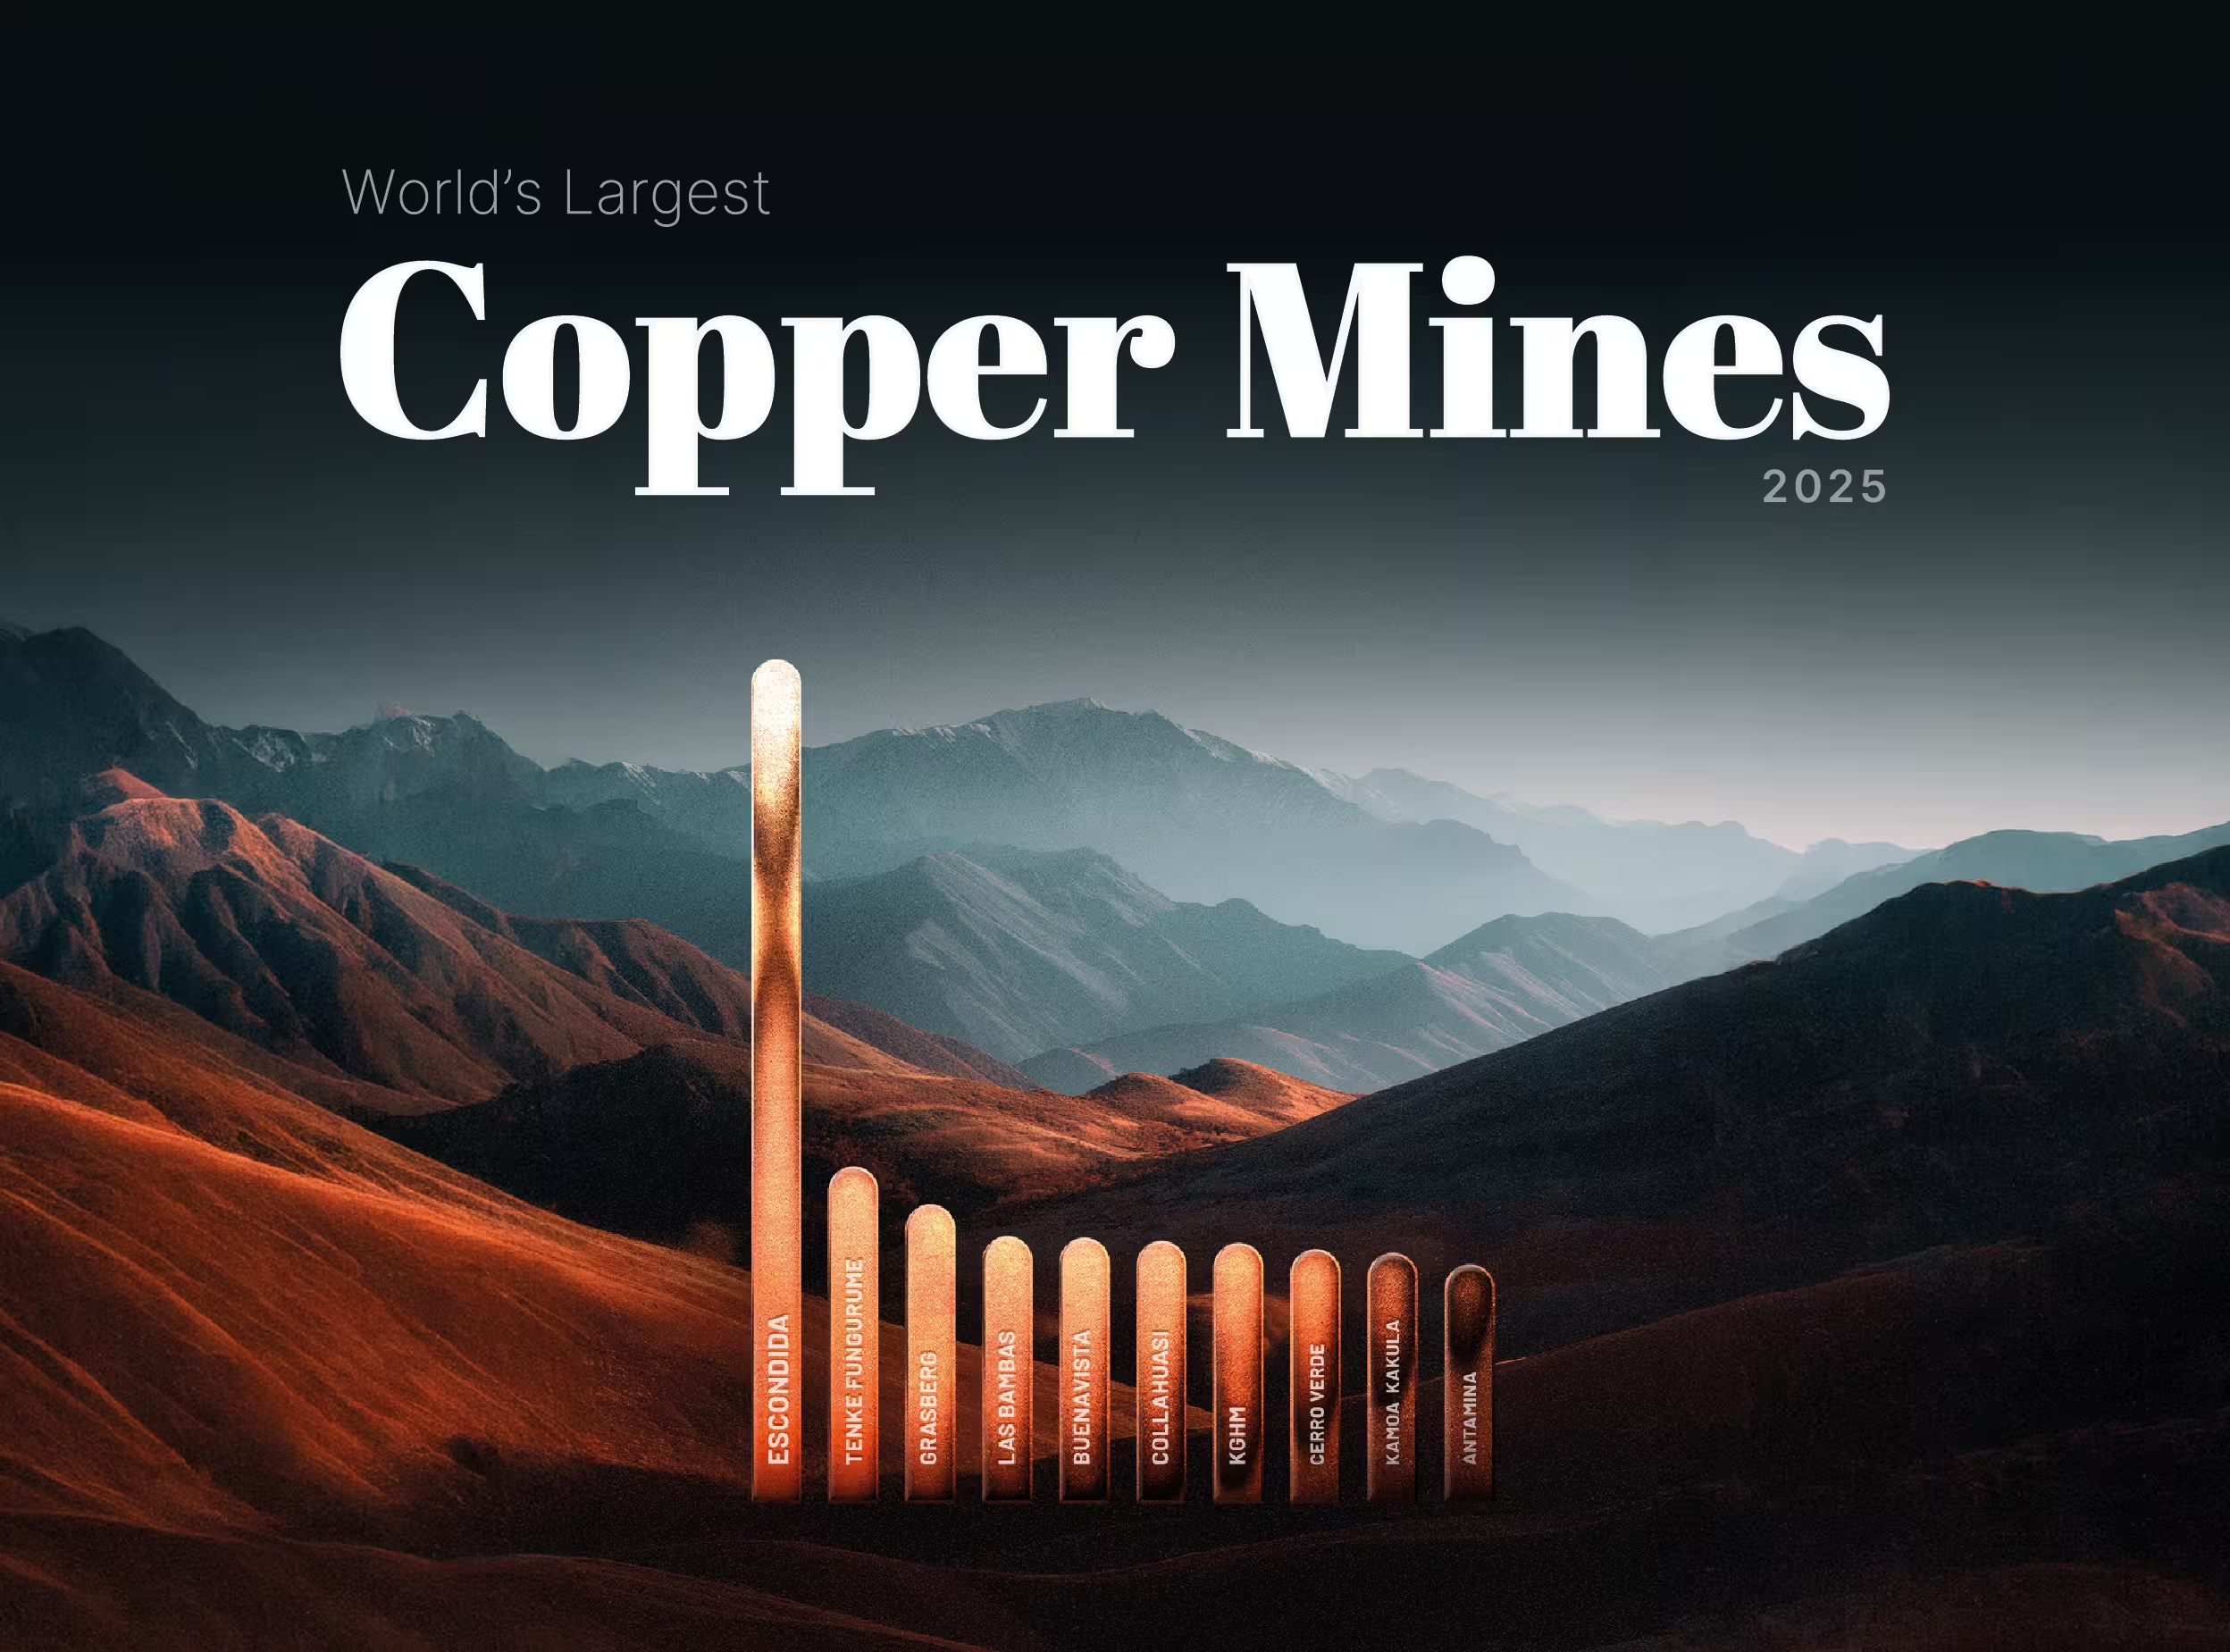
Ten operating mines in six countries each produced between 359,000 and 1.32 million tonnes of copper in 2025, according to Wood Mackenzie estimates. Reko Diq in Pakistan appears alongside them with a figure from Barrick’s feasibility study, which refers to planned future production. More than half of the ten mines’ combined output came from the five in South America. The 2025 figures also reflect a disrupted year at Grasberg in Indonesia, while Reko Diq’s number points to a project planned in two phases.
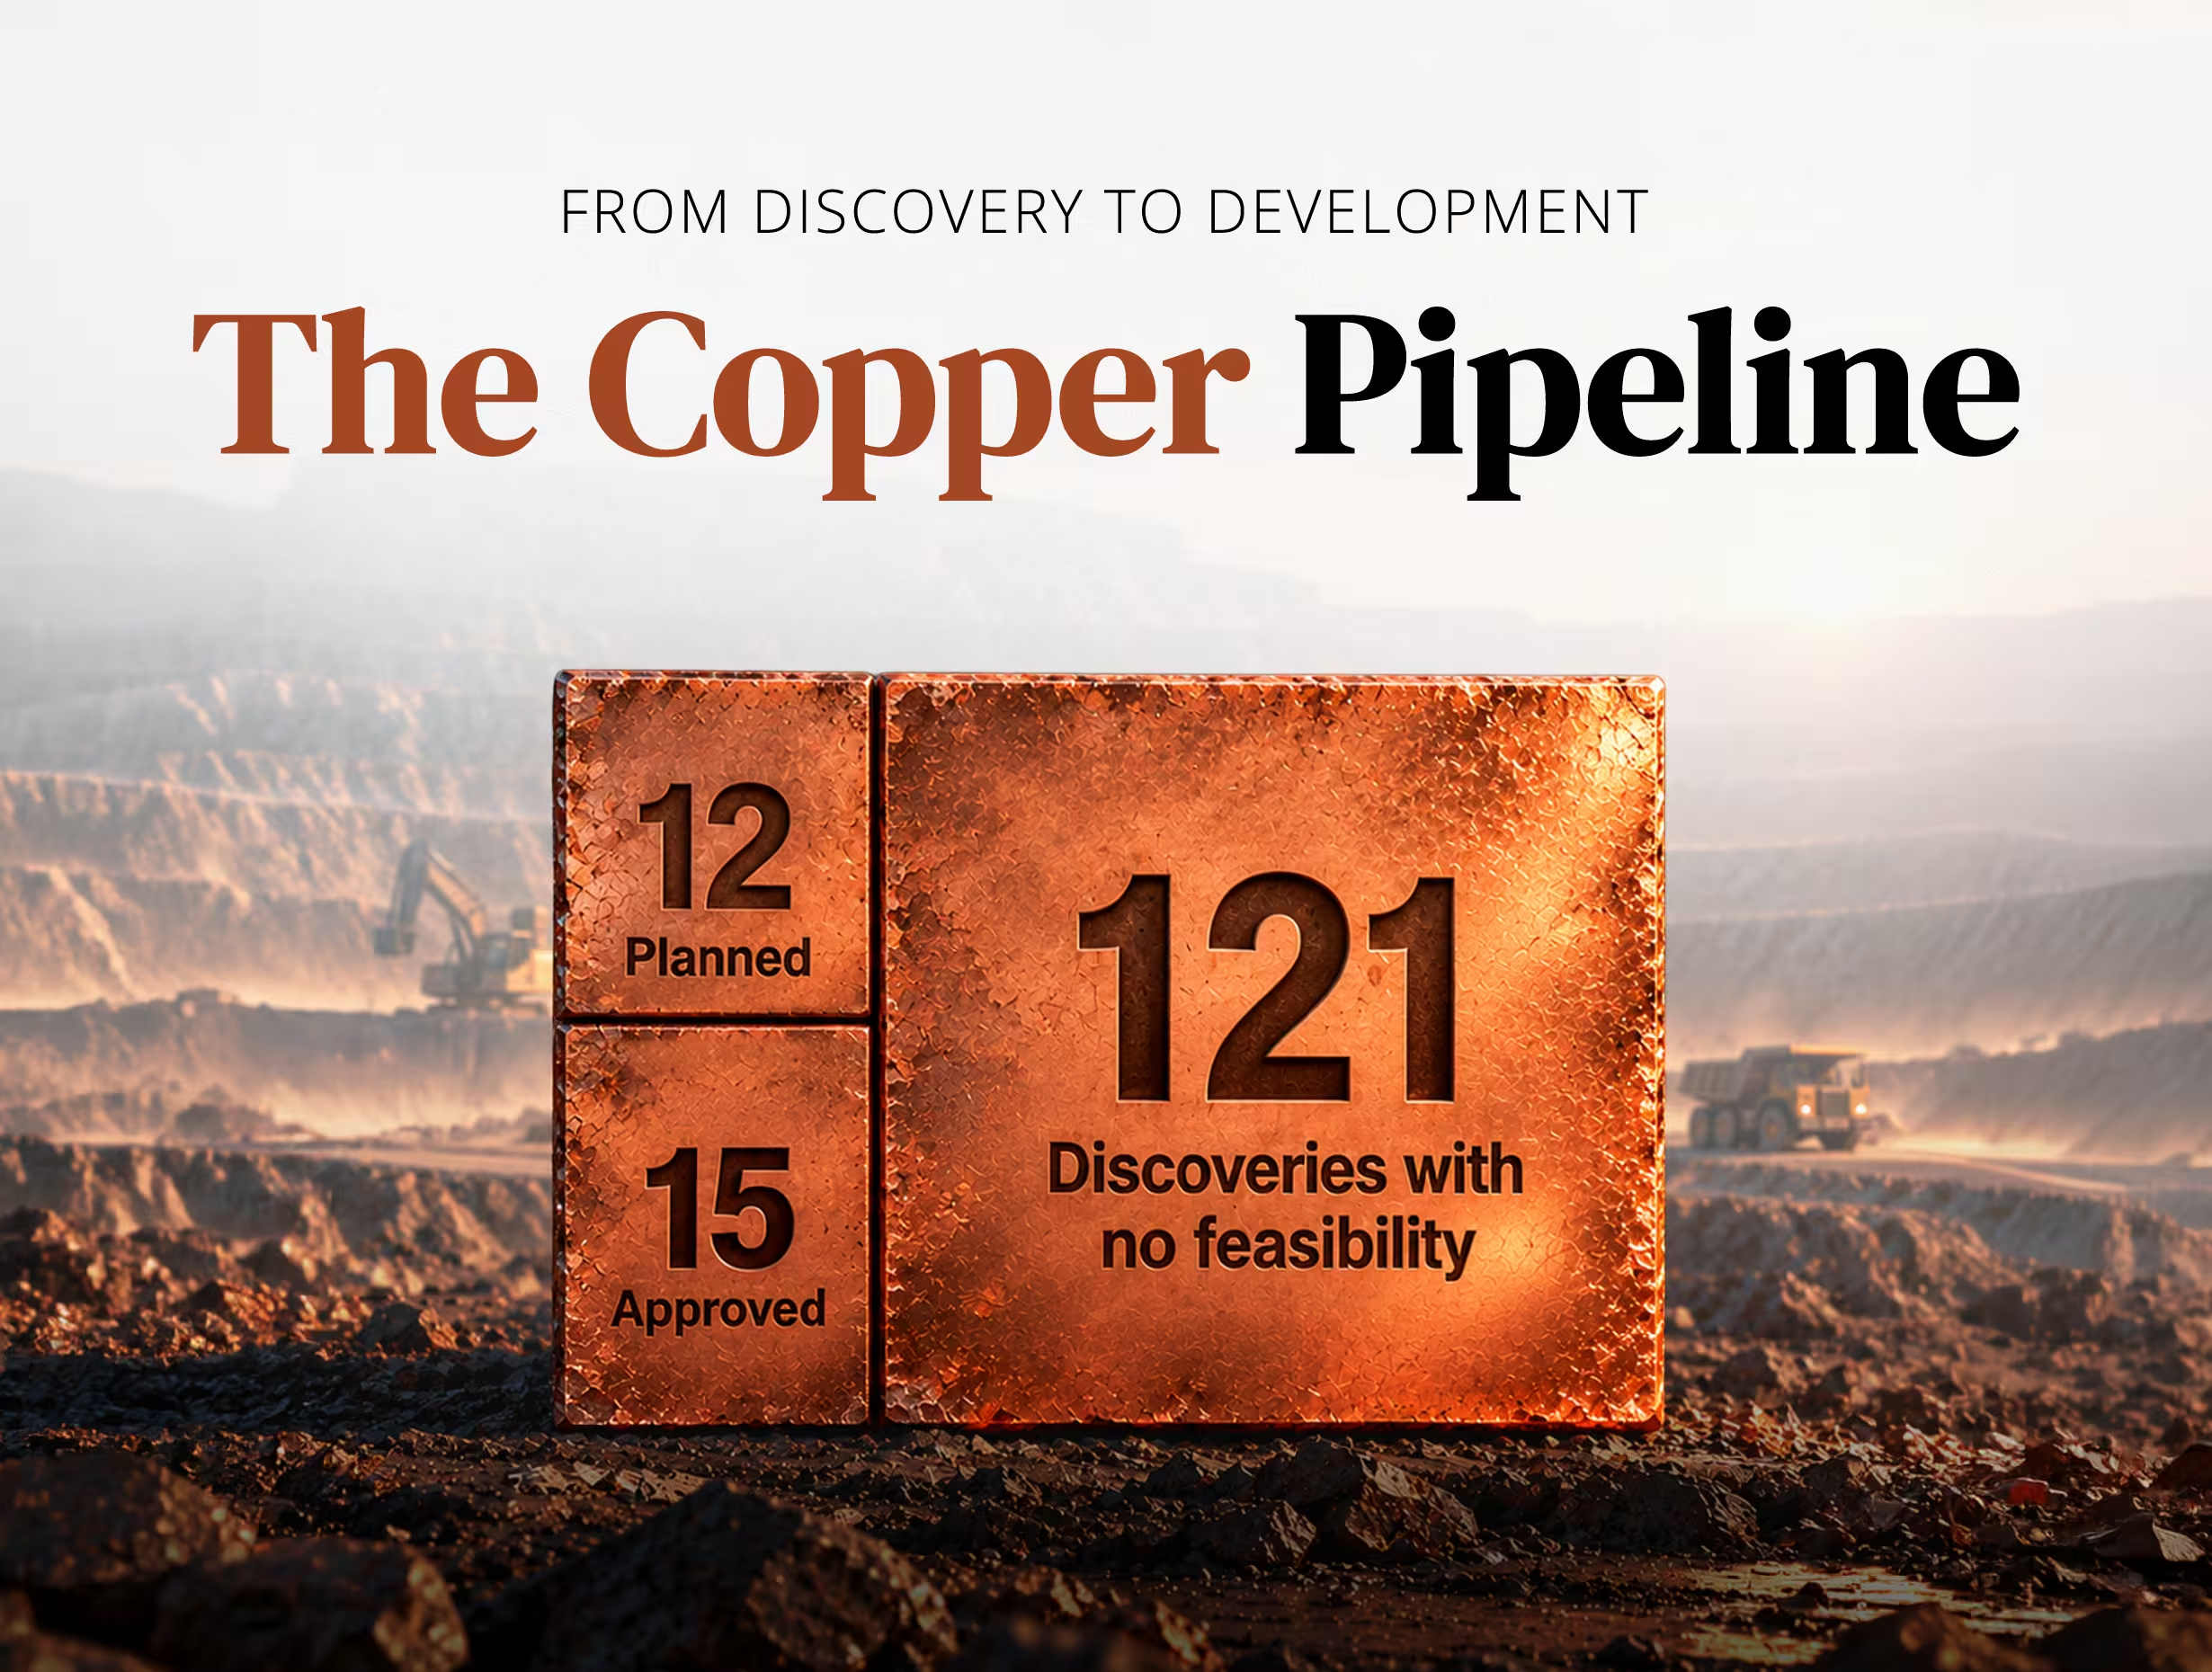
In May 2025, a joint venture of Lundin Mining and BHP released a resource estimate for its Vicuña district in the Andes, which S&P Global ranked as home to the largest greenfield copper discovery in 30 years. Per the same resource statement, the combined Filo del Sol and Josemaria deposits hold 13 million tonnes of contained copper in measured and indicated resources.
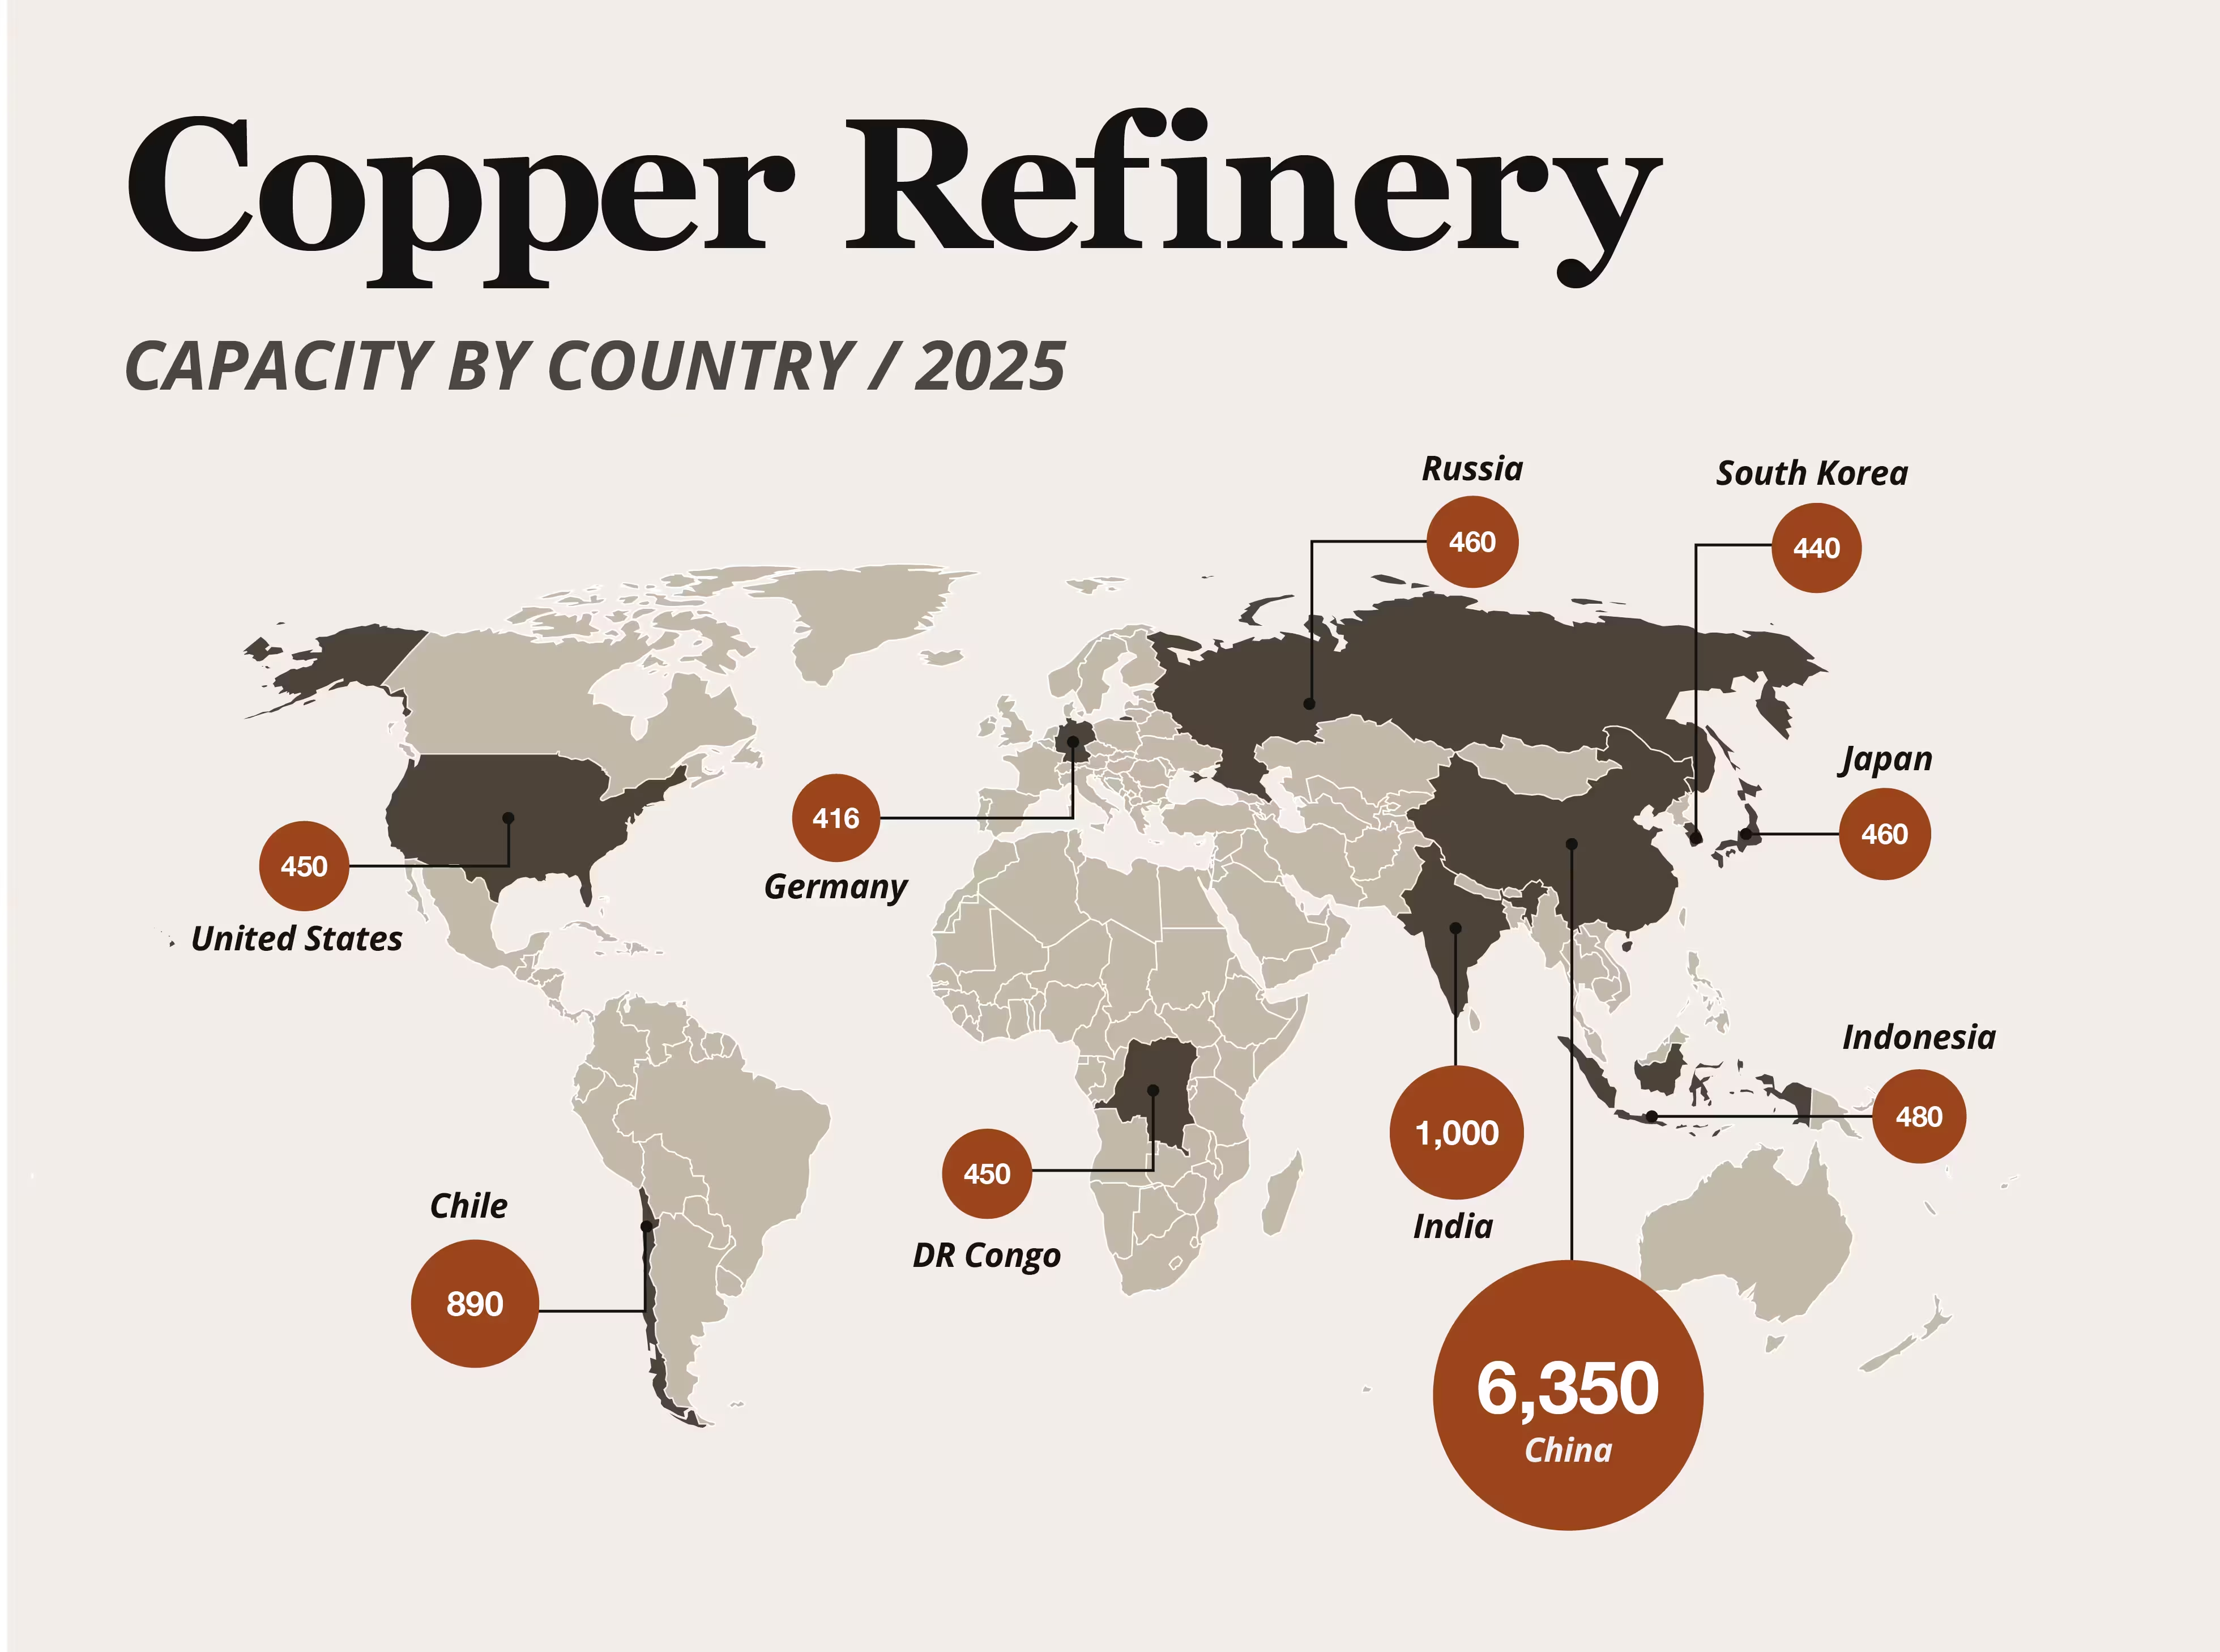
Indonesia's circle on the map above stands for a single plant: the Manyar refinery in East Java, operated by PT Freeport Indonesia, with 480,000 tonnes a year of capacity, according to the International Copper Study Group. It has been shut since the fourth quarter of 2025, after a mudflow at the Grasberg mine cut off its concentrate supply, and is due to restart this month at below 30% of capacity.
Copper has spent 2026 setting records, touching an intraday COMEX high of $6.71 per pound on May 13 amid AI-driven demand and supply shocks, against a backdrop where the ICSG now forecasts a 150,000-tonne deficit for 2026. In a market this tight, where the deficit thesis turns on lost tonnes, the question of where the world's copper actually comes from carries unusual weight.