Copper
May 14, 2026
2 min
Copper

Key takeaways
- The lowest-cost major in 2025 was Southern Copper at $0.58/lb, a 35% year-over-year drop driven almost entirely by a $0.34/lb surge in by-product credits, not underlying cost discipline.
- Rio Tinto delivered the largest improvement, cutting its Copper C1 net unit cost 53% to 67 c/lb on an 11% volume increase anchored by a 61% production surge at Oyu Tolgoi.
- State-owned Codelco saw its C1 rise 4.8% to 208.6 c/lb on a stronger Chilean peso and the El Teniente seismic disruption, while Canadian-listed First Quantum climbed $0.28/lb to $2.02/lb on lower Sentinel grades, highlighting that the cost pressures of 2025 were geography-agnostic.
Copper futures touched an all-time high above $6.58 per pound on May 12, 2026, capping a 40.86% gain over the prior twelve months as supply tightness collided with structural demand from grid build-out, electric vehicles, and AI data centers. In our previous analysis of copper production costs, we tracked how inflation, declining ore grades, and surging input costs pushed unit costs sharply higher across the major producers between 2019 and 2023. This update extends that picture through the now-closed 2024 and 2025 reporting cycles, and the story has shifted. Where the prior period was defined by costs rising in unison, 2024 and 2025 reveal a sharply bifurcated curve: some producers compressed unit costs to multi-year lows on surging by-product credits, while others saw costs climb under grade decline, seismic events, and stronger producer currencies.
The By-Product Revolution: Why "Cost" Often Means "Credit"
The steepest cost reductions in 2025 came not from operational tightening but from the soaring market value of co-produced metals. Antofagasta's group net cash cost fell 27% year-over-year to $1.19/lb, but its underlying cash costs before by-product credits were essentially flat. The improvement came from record credits, fueled by a 13% rise in gold production and a 48% jump in molybdenum output, as detailed in the company's Q4 2025 production report.
The pattern was even more extreme at Southern Copper. Per the company's Q4 2025 earnings disclosure, operating cash cost before by-product credits actually rose to $2.17/lb in 2025 from $2.13/lb in 2024. Net cash cost nonetheless collapsed to $0.58/lb thanks to a $0.34/lb increase in by-product credits, supported by higher silver and zinc output from the Buenavista zinc concentrator, down from the company's 2024 net cash cost of $0.89/lb.
The distinction matters: a net cash cost compressed by precious-metals tailwinds can reverse quickly if gold, silver, or moly prices fall.
Volume Cures: The Rio Tinto and BHP Playbooks
Two majors leaned on a different lever: producing more copper to spread fixed costs. Rio Tinto's 2025 Copper C1 net unit cost fell 53% to 67 cents per pound, driven by higher production at Escondida and Oyu Tolgoi alongside higher by-product credits from gold. The Oyu Tolgoi underground project delivered a 61% production surge in 2025 as the underground mine reached scale, per the company's full-year results release.
BHP's Escondida, the world's largest copper mine, followed a similar pattern. Per the company's FY25 results announcement, unit cash costs fell 18% to $1.19/lb (year ended June 30, 2025), as the asset delivered its highest copper production in 17 years on higher feed grades of 1.02% versus 0.88% the prior year.
Where Costs Rose: Codelco, First Quantum, Freeport, and Teck
Chile's Codelco saw its Direct C1 cash cost increase to 208.6 cents/lb in 2025, up from 199.1 cents the prior year, with the company citing equipment rental costs, higher maintenance expenses, and lower by-product credits. Foreign exchange also reversed: where 2024 benefited from a weaker Chilean peso, 2025 saw the peso appreciate against the U.S. dollar.
First Quantum's Copper C1 cash cost of $2.02 per pound for 2025, excluding Cobre Panamá, was $0.28 per lb higher than the prior year due to lower production at Sentinel as well as higher employee, maintenance, and contractor costs. The headwind was partially offset by commercial production at the Kansanshi S3 Expansion on December 1, 2025, which contributed roughly 25kt and stands in contrast to the company's 2024 C1 cost of $1.74/lb.
Freeport-McMoRan reported per its Q4 2025 earnings discussion a full-year unit net cash cost of $1.65/lb, up from $1.56/lb in 2024, with Q4 spiking to $2.22/lb after the September Grasberg mudflow incident. Teck Resources, still absorbing the Quebrada Blanca ramp-up, posted a 2025 net cash unit cost of $2.03/lb per its 2025 MD&A, with QB specifically running at $2.67/lb.
The Anglo American Anomaly: Discipline Holds the Line
Per the company's full-year 2025 results, Anglo American's total copper unit cost came in at 150 c/lb, broadly flat versus 151 c/lb in 2024, despite a 17% production decline at Collahuasi. Peru's Quellaveco mine delivered another standout performance with unit costs of just 89 c/lb. The company has guided 2026 copper unit costs to approximately 172 c/lb, driven mainly by the impact of a stronger Chilean peso, a forecast signaling sector-wide currency headwinds in the year ahead.
Closing Synthesis: A Two-Tier Cost Curve in a Record-Price Market
For 2025, the gap between the lowest-cost and highest-cost major producer widened to more than $2.00 per pound, from Southern Copper's net $0.58/lb to Teck's Quebrada Blanca at $2.67/lb. With LME copper trading well above $10,000 per tonne, even the highest-cost mines are profitable today. But the data underscores that 2025's cost improvements relied heavily on two specific levers: by-product credits from precious metals and one-time volume ramps at projects like Oyu Tolgoi and Quellaveco. The 2026 guidance disclosed by Anglo American, Codelco, and Freeport already points to costs rising again, with producer-currency strength flagged repeatedly. The cost curve may be entering its own cyclical reversal, even as the copper price holds near record territory.
MiningVisuals Disclaimer: This article is for informational purposes only and does not constitute financial or investment advice. Always conduct your own research. All data points and statements above are sourced via embedded hyperlinks directly from company financial filings, earnings releases, and reputable financial news outlets.


Explore More
View All
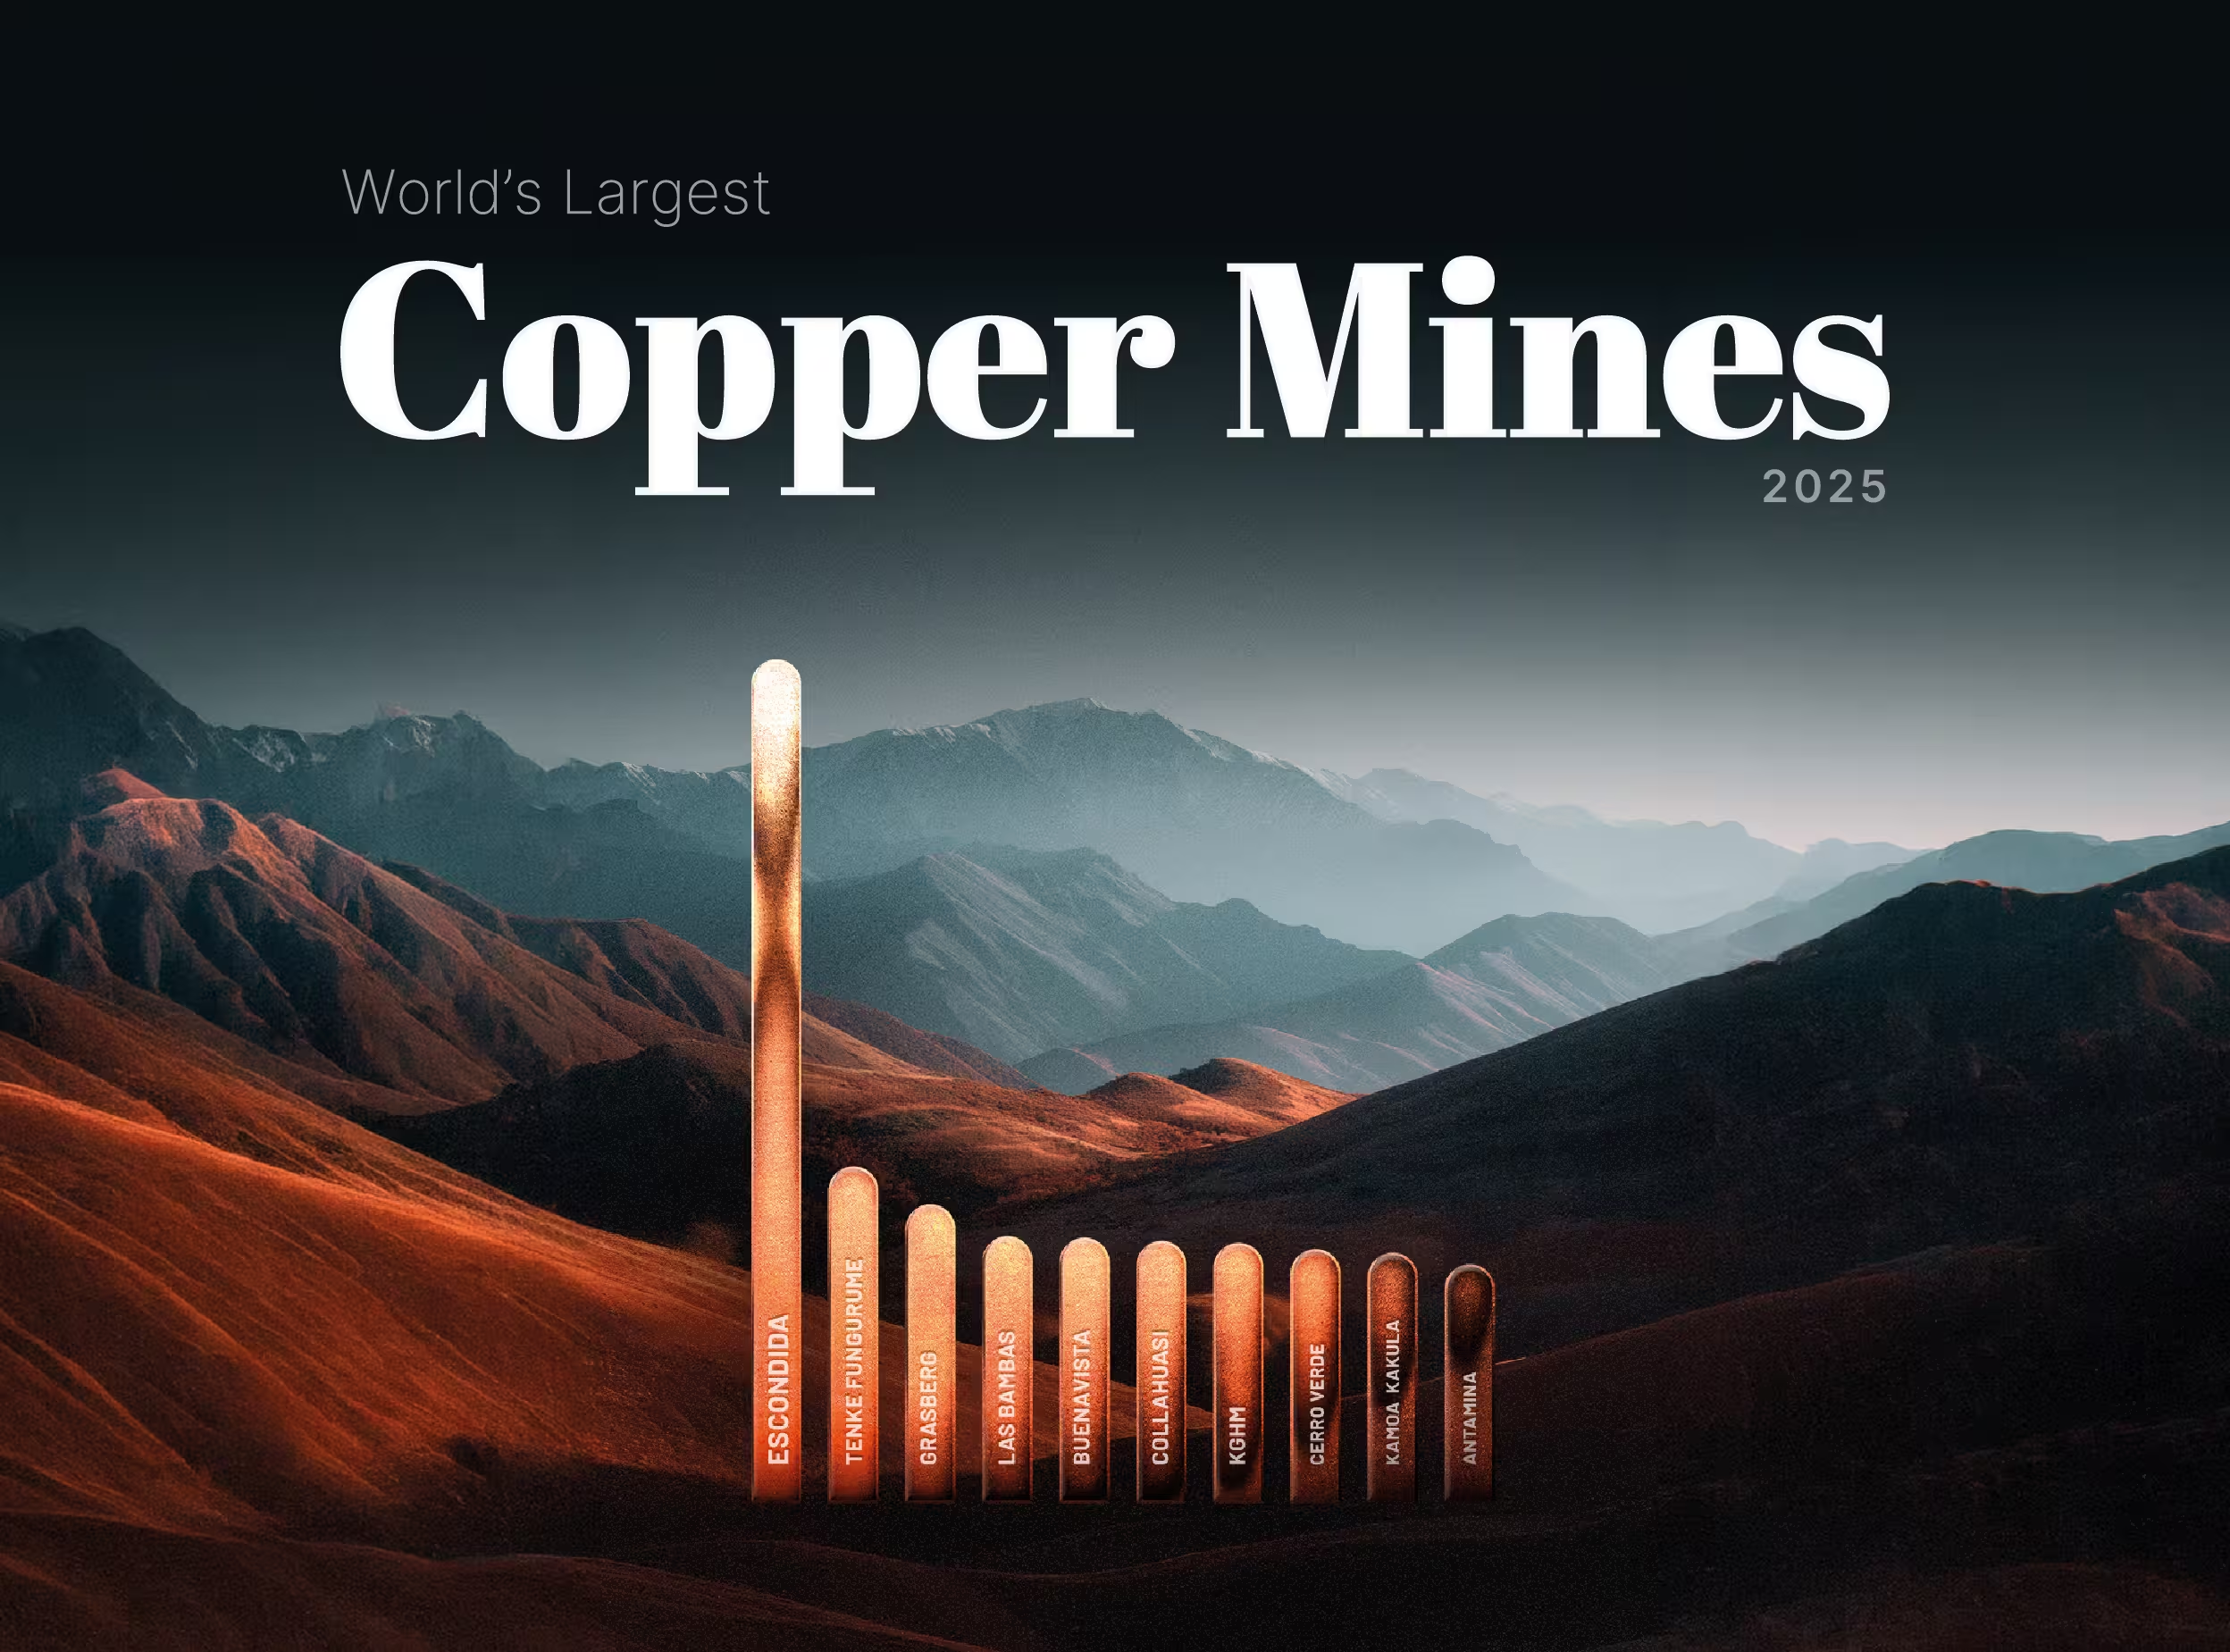
Ranked: The World's Largest Copper Mines (2025)
Ranked: The World's Largest Copper Mines (2025)
Copper has spent 2026 setting records, touching an intraday COMEX high of $6.71 per pound on May 13 amid AI-driven demand and supply shocks, against a backdrop where the ICSG now forecasts a 150,000-tonne deficit for 2026. In a market this tight, where the deficit thesis turns on lost tonnes, the question of where the world's copper actually comes from carries unusual weight.

Copper on Track for Its Highest Monthly Close on Record: A Look at the Drivers
Copper on Track for Its Highest Monthly Close on Record: A Look at the Drivers
Copper has spent most of 2026 doing something it had not done in a quarter century: setting fresh records every few weeks. The COMEX contract printed an intraday all-time high of $6.71 per pound on May 13, and the May monthly close looks set to land at the top of the historical chart. In London, copper traded above $14,000 per tonne in mid-May, touching $14,196.50, within reach of the LME's January 29 record of $14,527.50.
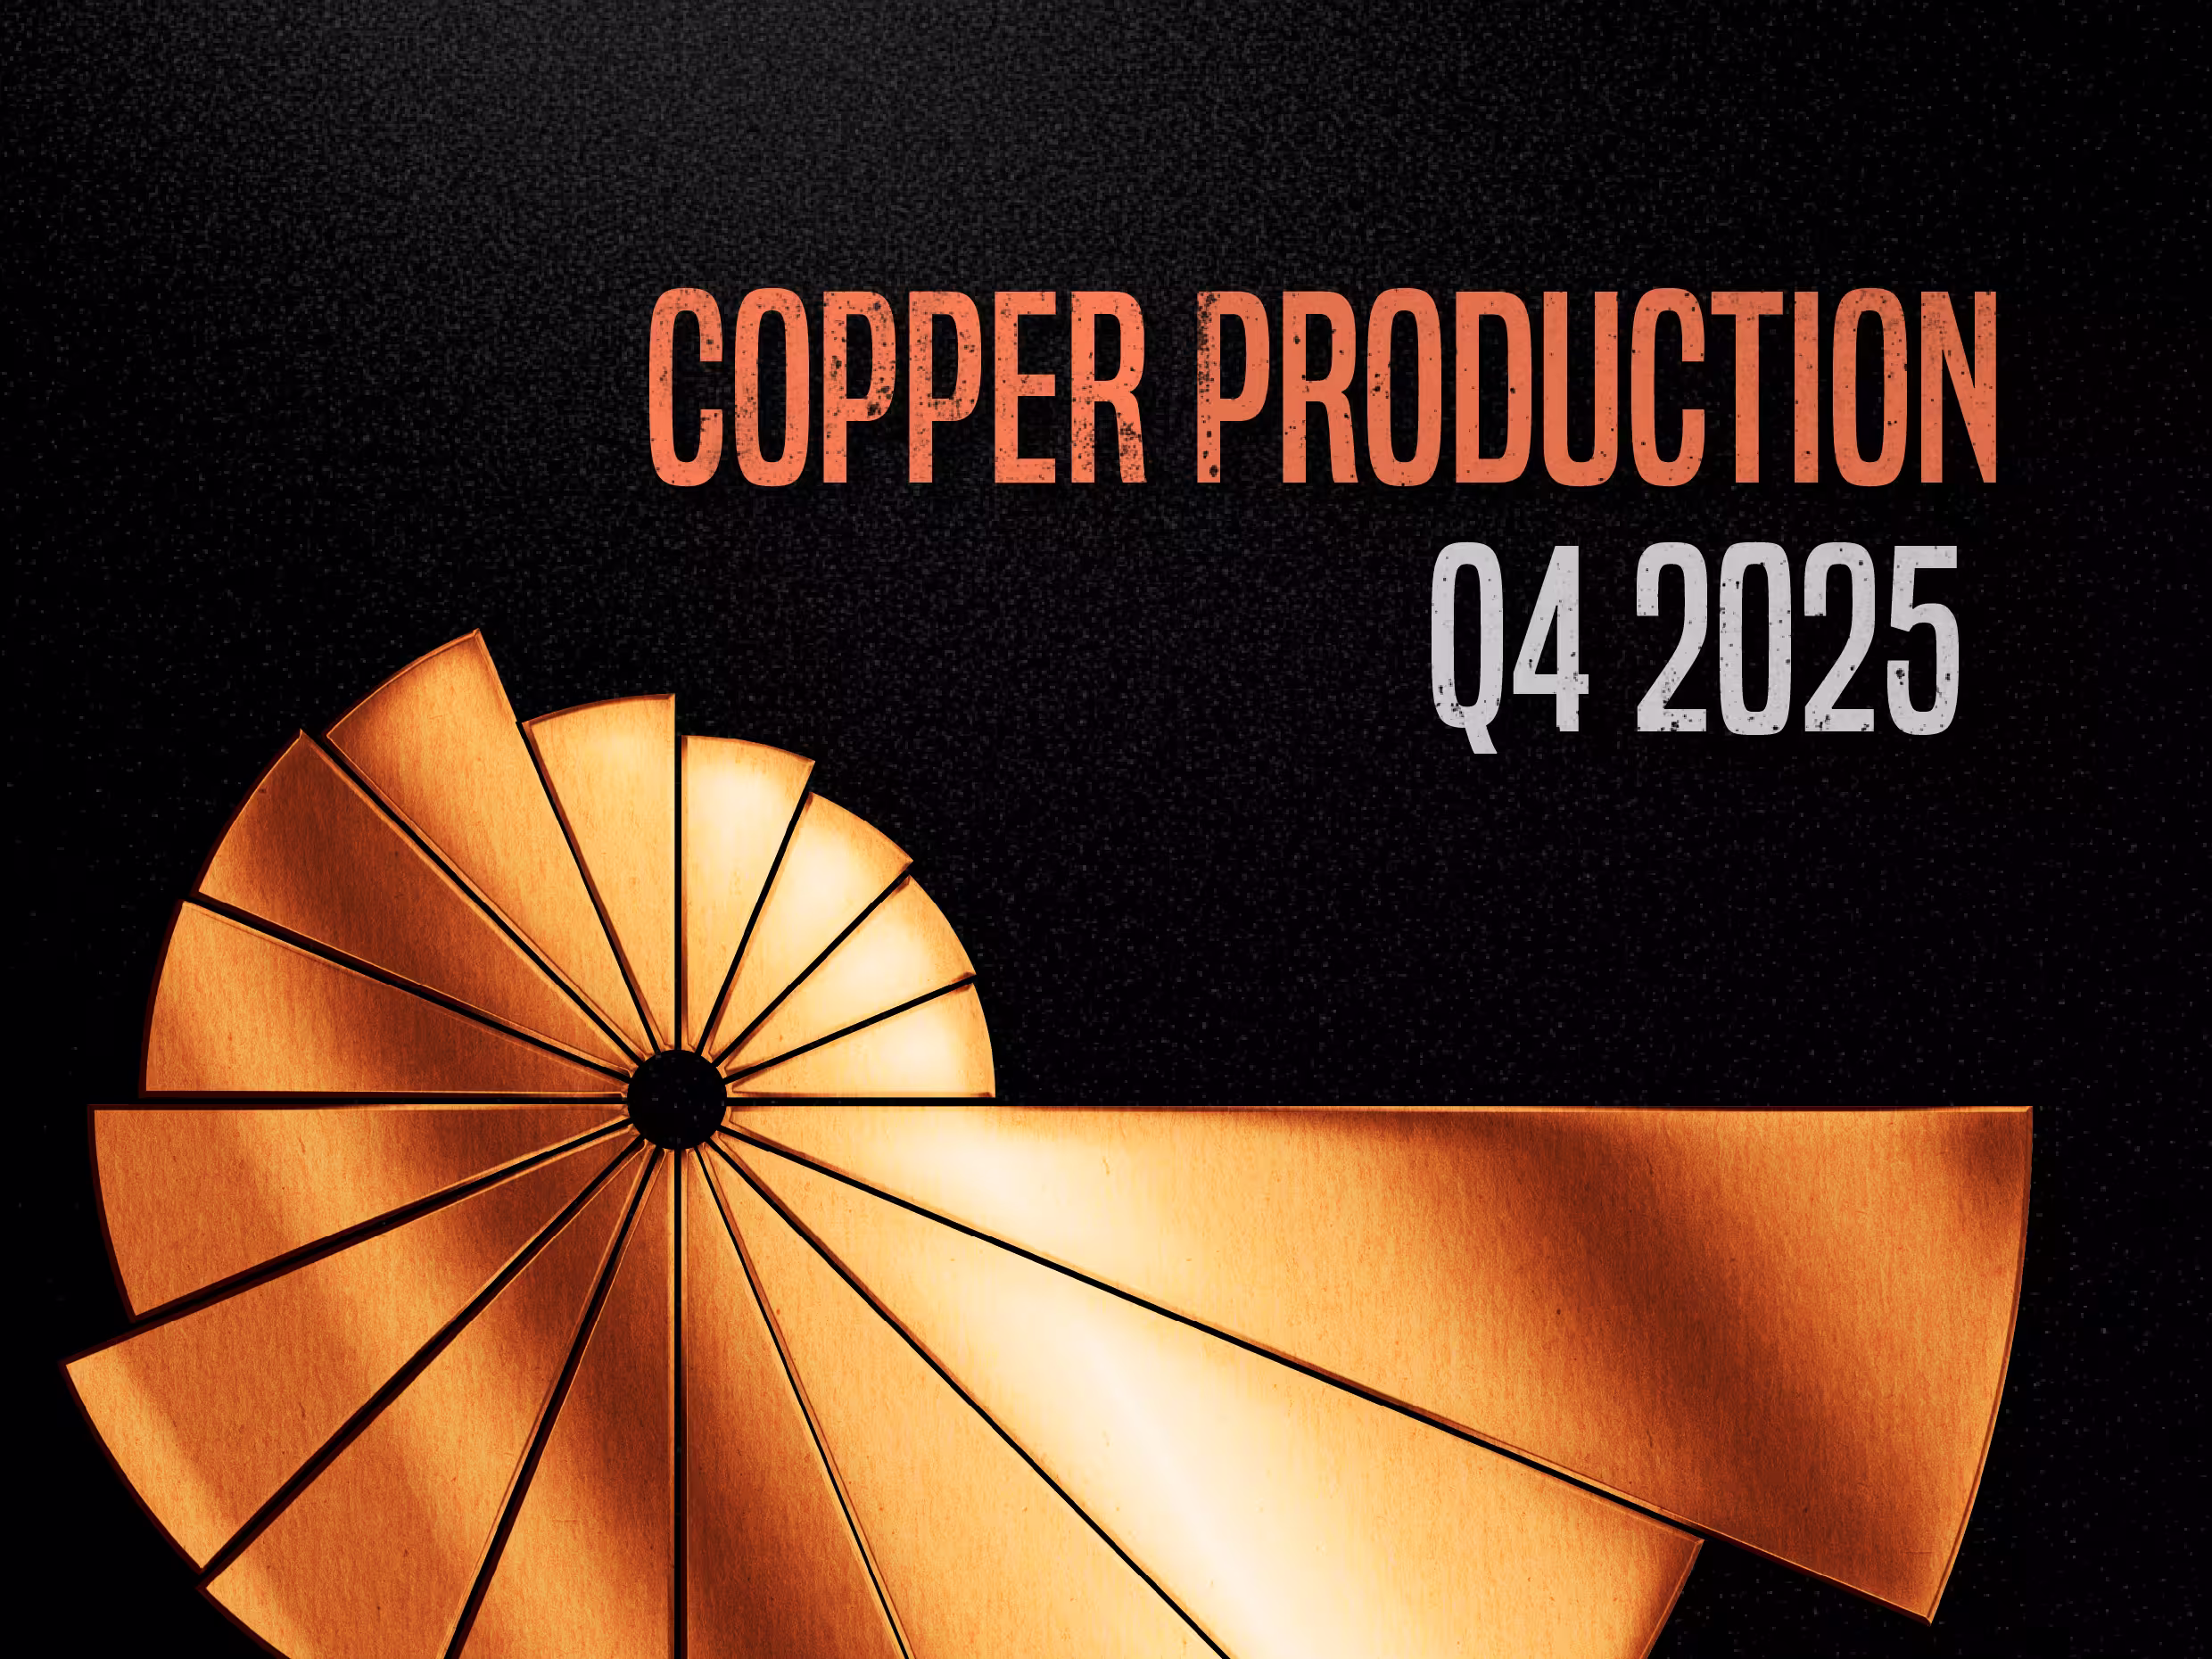
Copper Production Q4 2025
Copper Production Q4 2025
As power-hungry AI data centers drive a projected 2-million-ton surge in global copper demand by 2030, market attention remains fixated on the supply side. Fourth-quarter 2025 metrics provide a definitive look at how the world's top miners closed out the year. While overall volumes remain heavily concentrated among a few historic industry giants, the true Q4 narratives emerged further down the list, as mid-tier producers leveraged flagship asset expansions to hit multi-year highs and offset the sector's ongoing struggle with declining ore grades.

Copper Market Balance: A Look at 2026 Deficit Forecasts
Copper Market Balance: A Look at 2026 Deficit Forecasts
For years, analysts modeling the global copper market were comforted by a reliable buffer of surplus supply. But as our latest data visualization reveals, that cushion has violently evaporated. The International Copper Study Group (ICSG) has officially abandoned its projected surplus for 2025 to officially forecast a 150,000-metric-ton deficit for 2026—the market's first structural shortage since 2009. Wall Street is bracing for an even harsher reality.