Precious Metals
Seven Events That Shaped a Century of Gold Prices
IN TODAY'S MONEY, AN OUNCE IS WORTH ALMOST FIVE TIMES WHAT IT WAS IN 1934.
The following content is sponsored by Galiano Gold


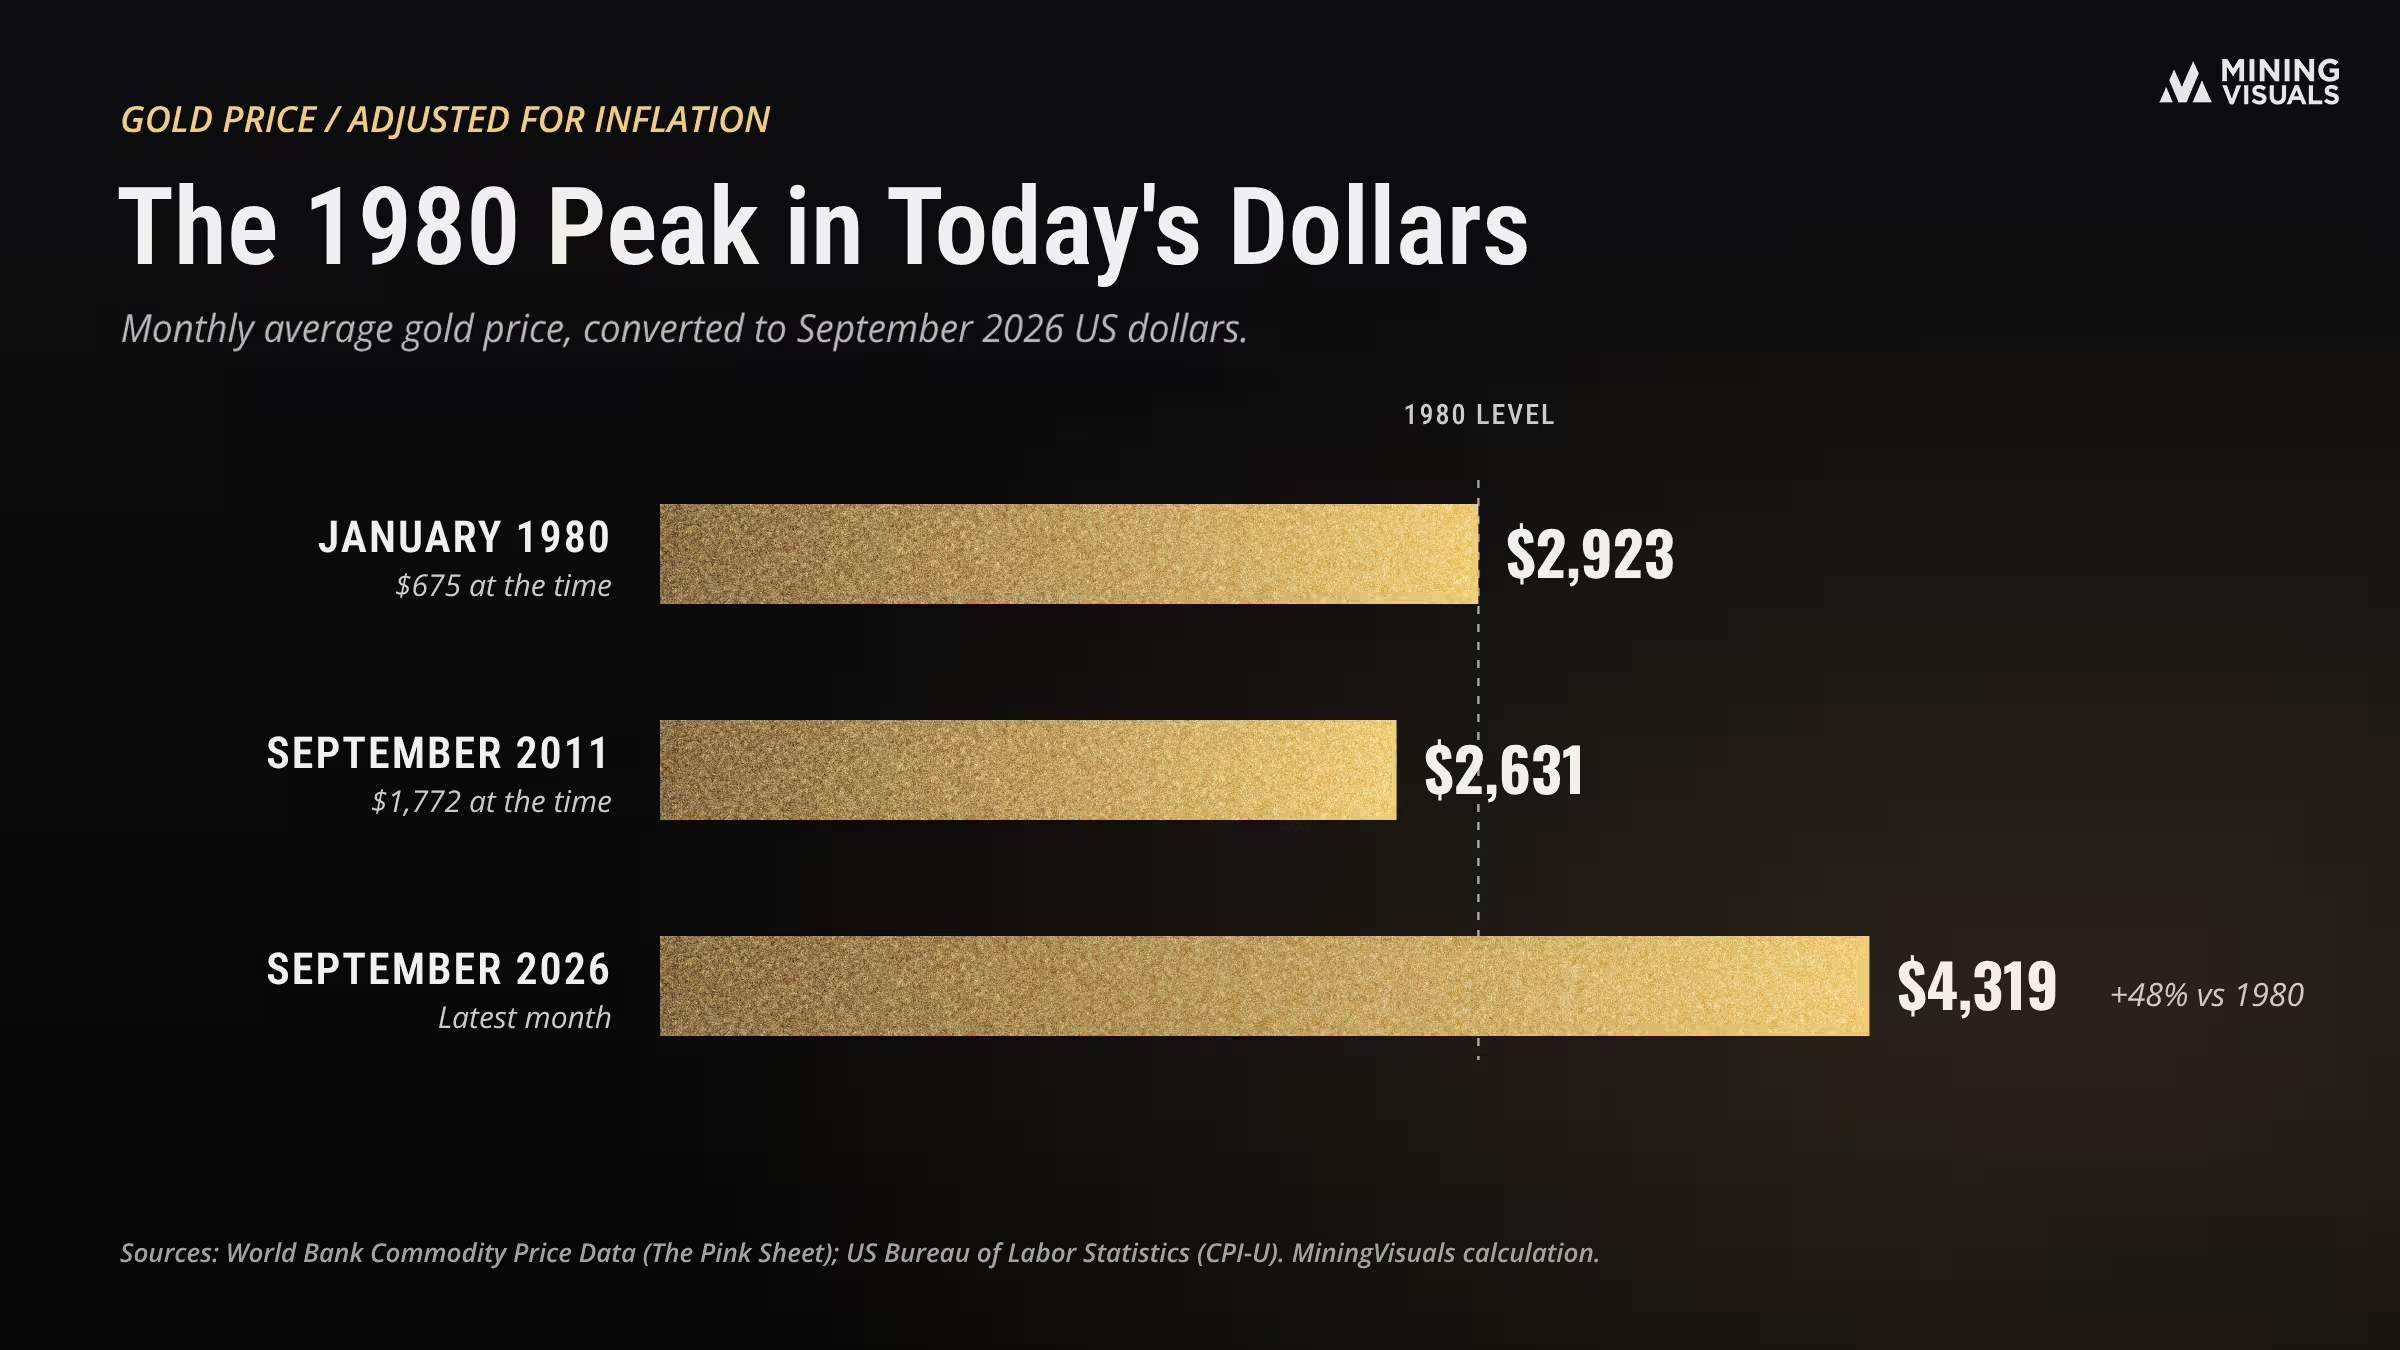
Above 1980 After Inflation: Adjusted with US consumer prices, 1980's peak equals about $2,920 today, below September's $4,319.
Record Margins for Miners: Producers earned a record average margin of US$3,076 an ounce over their all-in costs in Q1 2026.
Record Quarter for Gold ETFs: Gold funds took in a record US$31 billion in the third quarter of 2026.
In 1934, the US government raised the official price of gold from $20.67 to $35 an ounce. In September 2026, the market price averaged $4,319.
Measured in today’s money, gold has done more than keep up with rising prices. An ounce is now worth almost five times what it was when the price was raised to $35 in 1934, and more than at the famous 1980 peak. For the companies that mine it, that has meant record margins.
While the price stayed fixed at $35, the prices Americans paid for everyday goods and services roughly tripled between 1934 and 1971, according to the Bureau of Labor Statistics.
So each year the same ounce bought less. In today’s money, $35 was worth about $890 in 1934 and only about $290 by 1971. Once the market took over in 1971, that changed quickly: by January 1980, the monthly average had reached $675.
A dollar in 1980 bought far more than a dollar does now. Adjusted with the US consumer price index, the $675 average of January 1980 equals about $2,920 in today's dollars.
September's average of $4,319 is about 48% higher than that. The 2011 peak did not reach the 1980 level after inflation. September 2011 averaged $1,772, which equals about $2,630 today.
The average cost of producing an ounce of gold, including sustaining capital, was US$1,785 in the first quarter of 2026, according to the World Gold Council. Costs rose 16% from a year earlier, but prices rose faster, lifting the average margin to a record US$3,076 an ounce.
The council notes that miners have kept stricter cost and capital discipline than in earlier booms, and are returning cash to shareholders through dividends and buybacks. Output is rising too: mine production reached 966 tonnes in the second quarter, the highest second quarter in the council's data, which goes back to 2000.
Two markers on the chart, 2004 and 2022-26, point to buyers that are still active today. The 2004 marker is SPDR Gold Shares, launched in November 2004, which now holds about US$140 billion in assets. Gold ETFs worldwide took in a record US$31 billion in the third quarter of 2026, and kept buying through a September price dip that the World Gold Council links mainly to rising bond yields and a stronger US dollar.
The 2022-26 marker is central bank buying, which our October 5 article covered in detail. It has continued: central banks reported net purchases of 39 tonnes in August, led by China.

Galiano Gold Inc. (TSX: GAU) (NYSE American: GAU) is building momentum at the Asanko Gold Mine in Ghana, West Africa. With a strong, debt-free balance sheet, disciplined execution, and multiple operational and growth catalysts ahead, Galiano is focused on strengthening cash flow generation, growing Mineral Resources and Mineral Reserves, extending mine life, and delivering long-term shareholder value.
As a Canadian gold producer, Galiano is committed to responsible mining and sustainable value creation while contributing to Ghana's economic development through local employment, procurement, and community investment.
Learn more at www.galianogold.com.
MiningVisuals Disclaimer: This article is for informational purposes only and does not constitute financial or investment advice. Always conduct your own research.


In 2025, technology used 324 tonnes of gold, according to the World Gold Council's Q3 2026 data tables. At 2025's average price of $3,432 an ounce, that was worth about $35.8 billion, a MiningVisuals calculation from the council's figures. Most of it sits in parts that are never seen: the contacts, boards and wires that carry signals inside phones, servers and satellites.
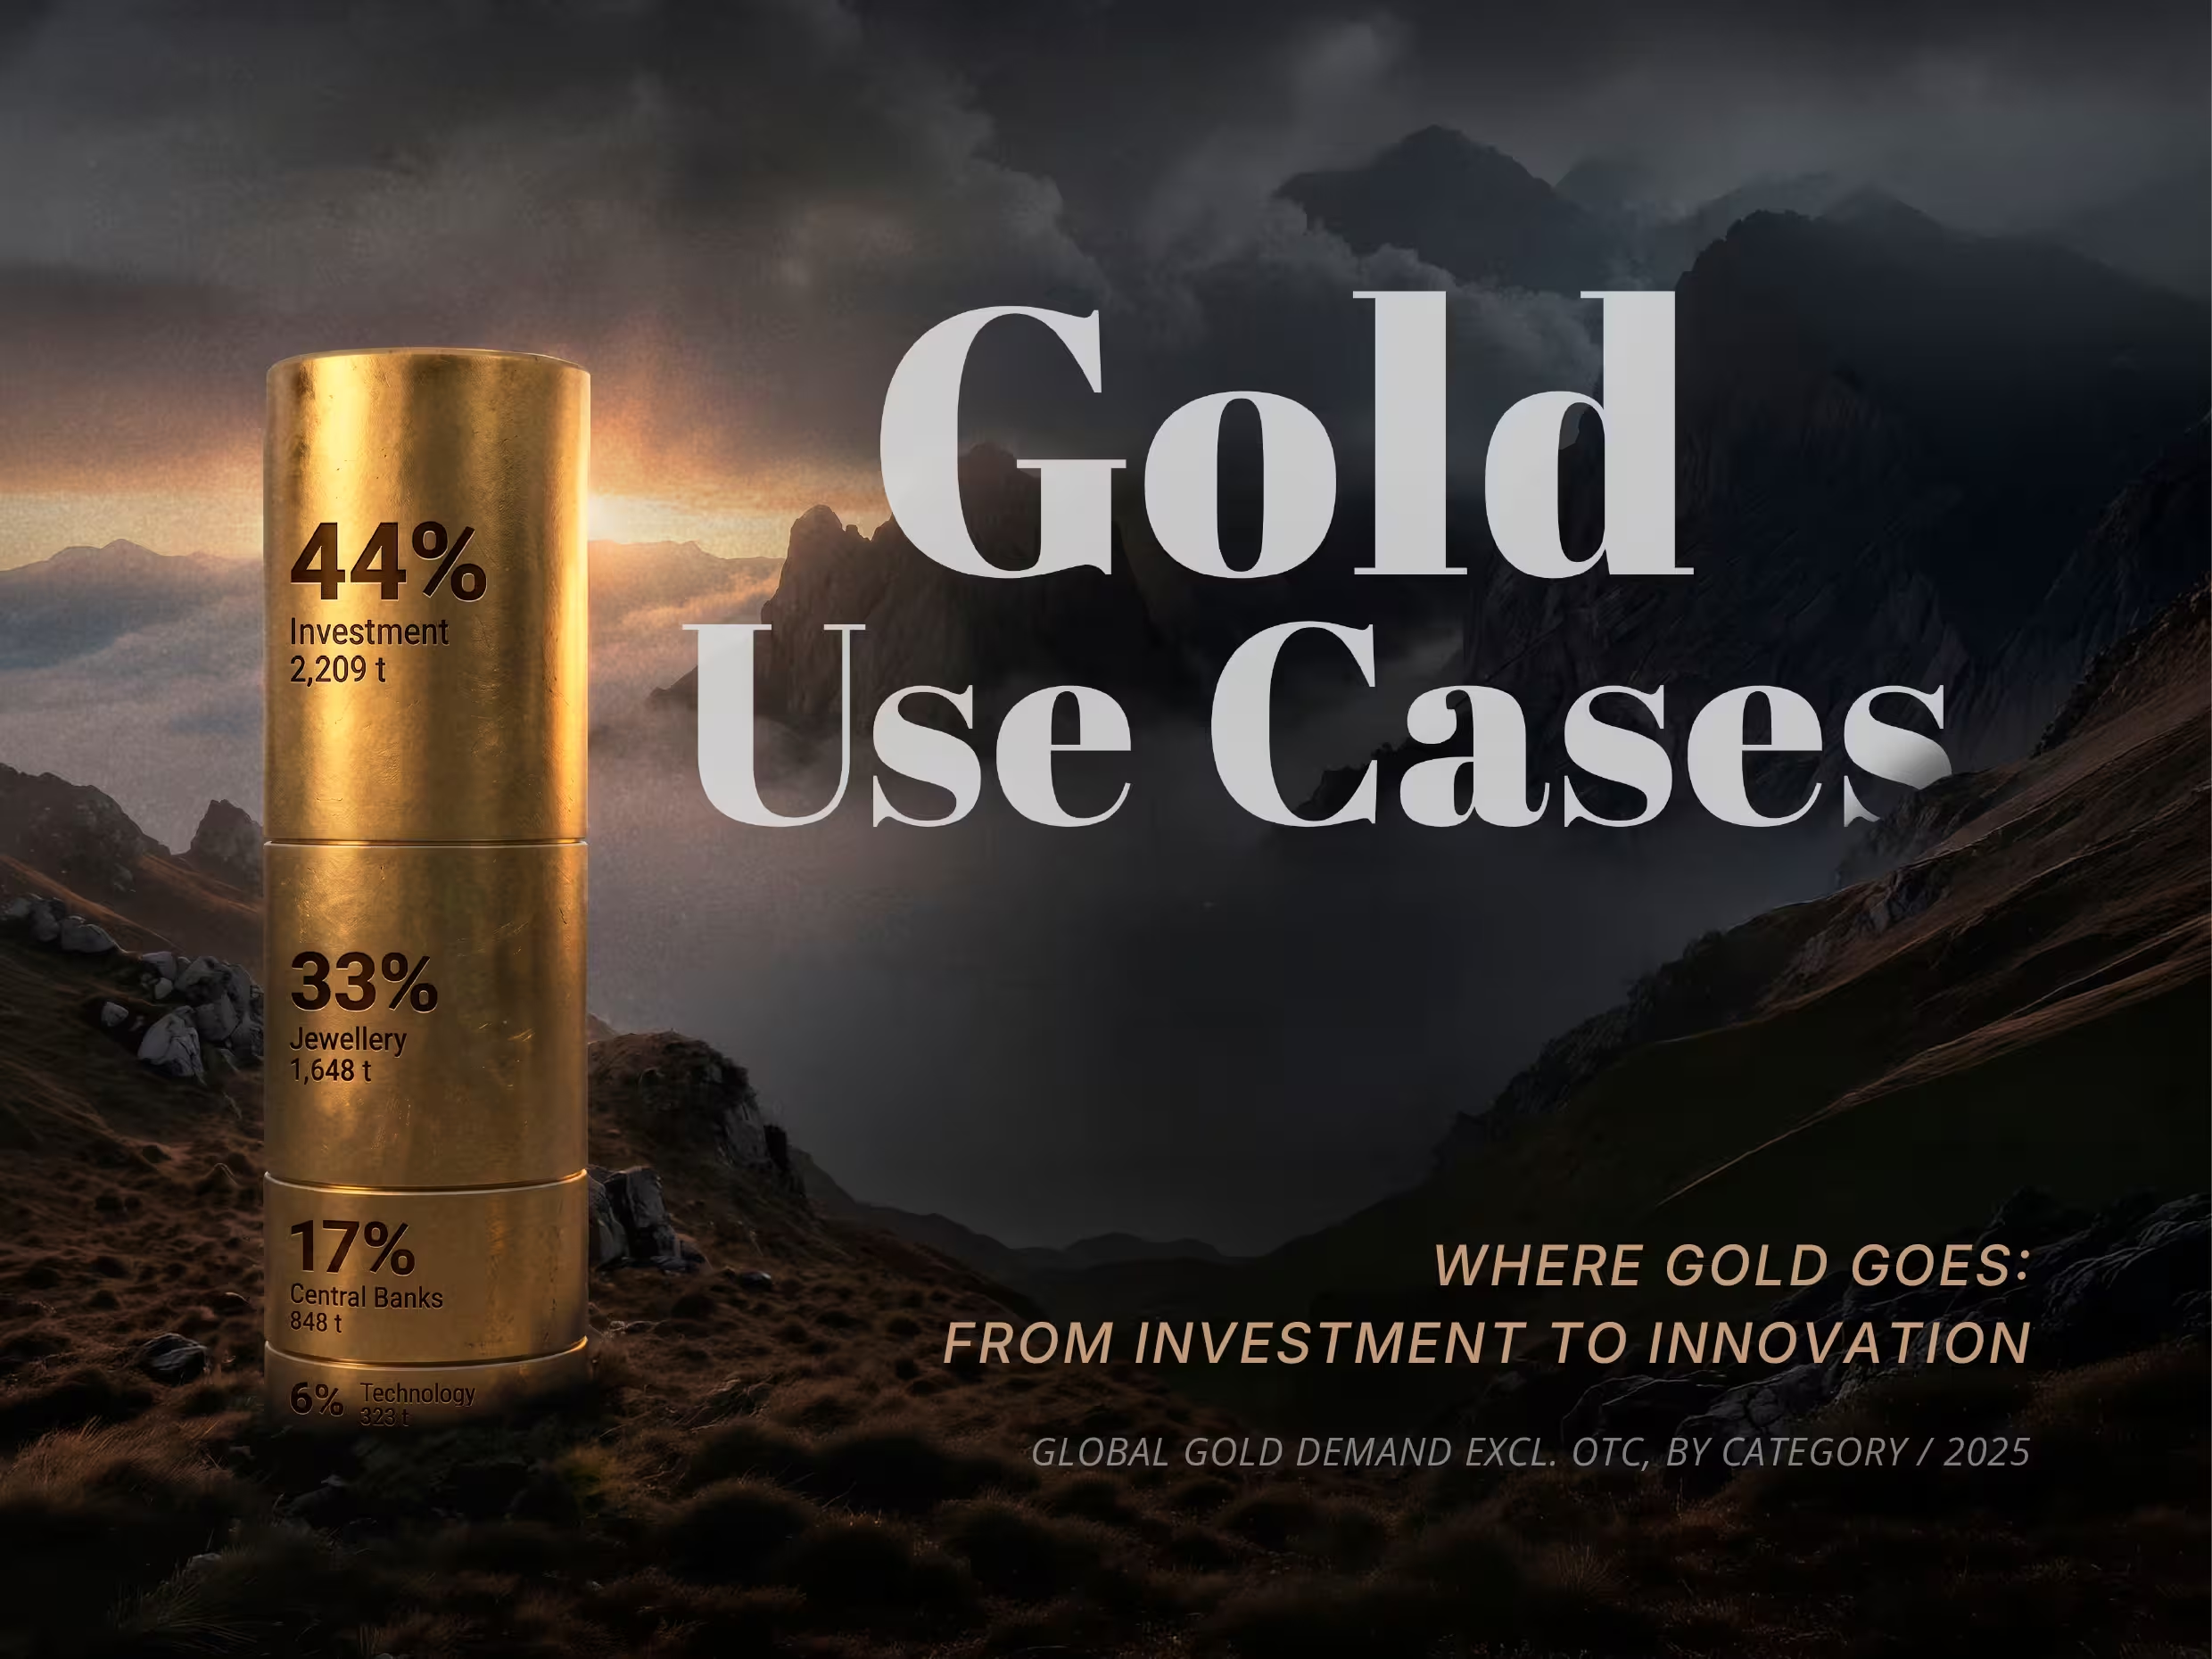
On June 16, 2026, the World Gold Council published its annual survey of central banks. A record 45% of the 76 respondents said they plan to increase their own gold holdings over the next 12 months, and 89% expect global central bank holdings to rise, according to the council. Central banks are one of four uses for the gold bought each year, and the balance between them has changed. In 2010, jewellery took 49% of demand and investment 39%, according to the council's data tables. In 2025, the order reversed: investment took 44% and jewellery 33%.

The largest silver producer among the world's primary silver mines in 2025 sat not in Mexico but in southwestern Bolivia. San Cristóbal, a large open-pit silver-zinc-lead mine run by Minera San Cristóbal, produced 17.6 million ounces of silver, narrowly ahead of Mexico's Juanicipio at the same rounded figure, in new Metals Focus data on the 20 largest primary silver mines. These are the operations where silver is a defining product rather than an incidental byproduct of lead, zinc and gold. The list runs from centuries-old mines in Mexico's silver belt to remote sites in the Andes, the Australian outback and the Alaskan wilderness. Eight of the 20 sit in Mexico, together about 44% of the total, while the rest are spread across the Americas, Asia, Africa and Australia.
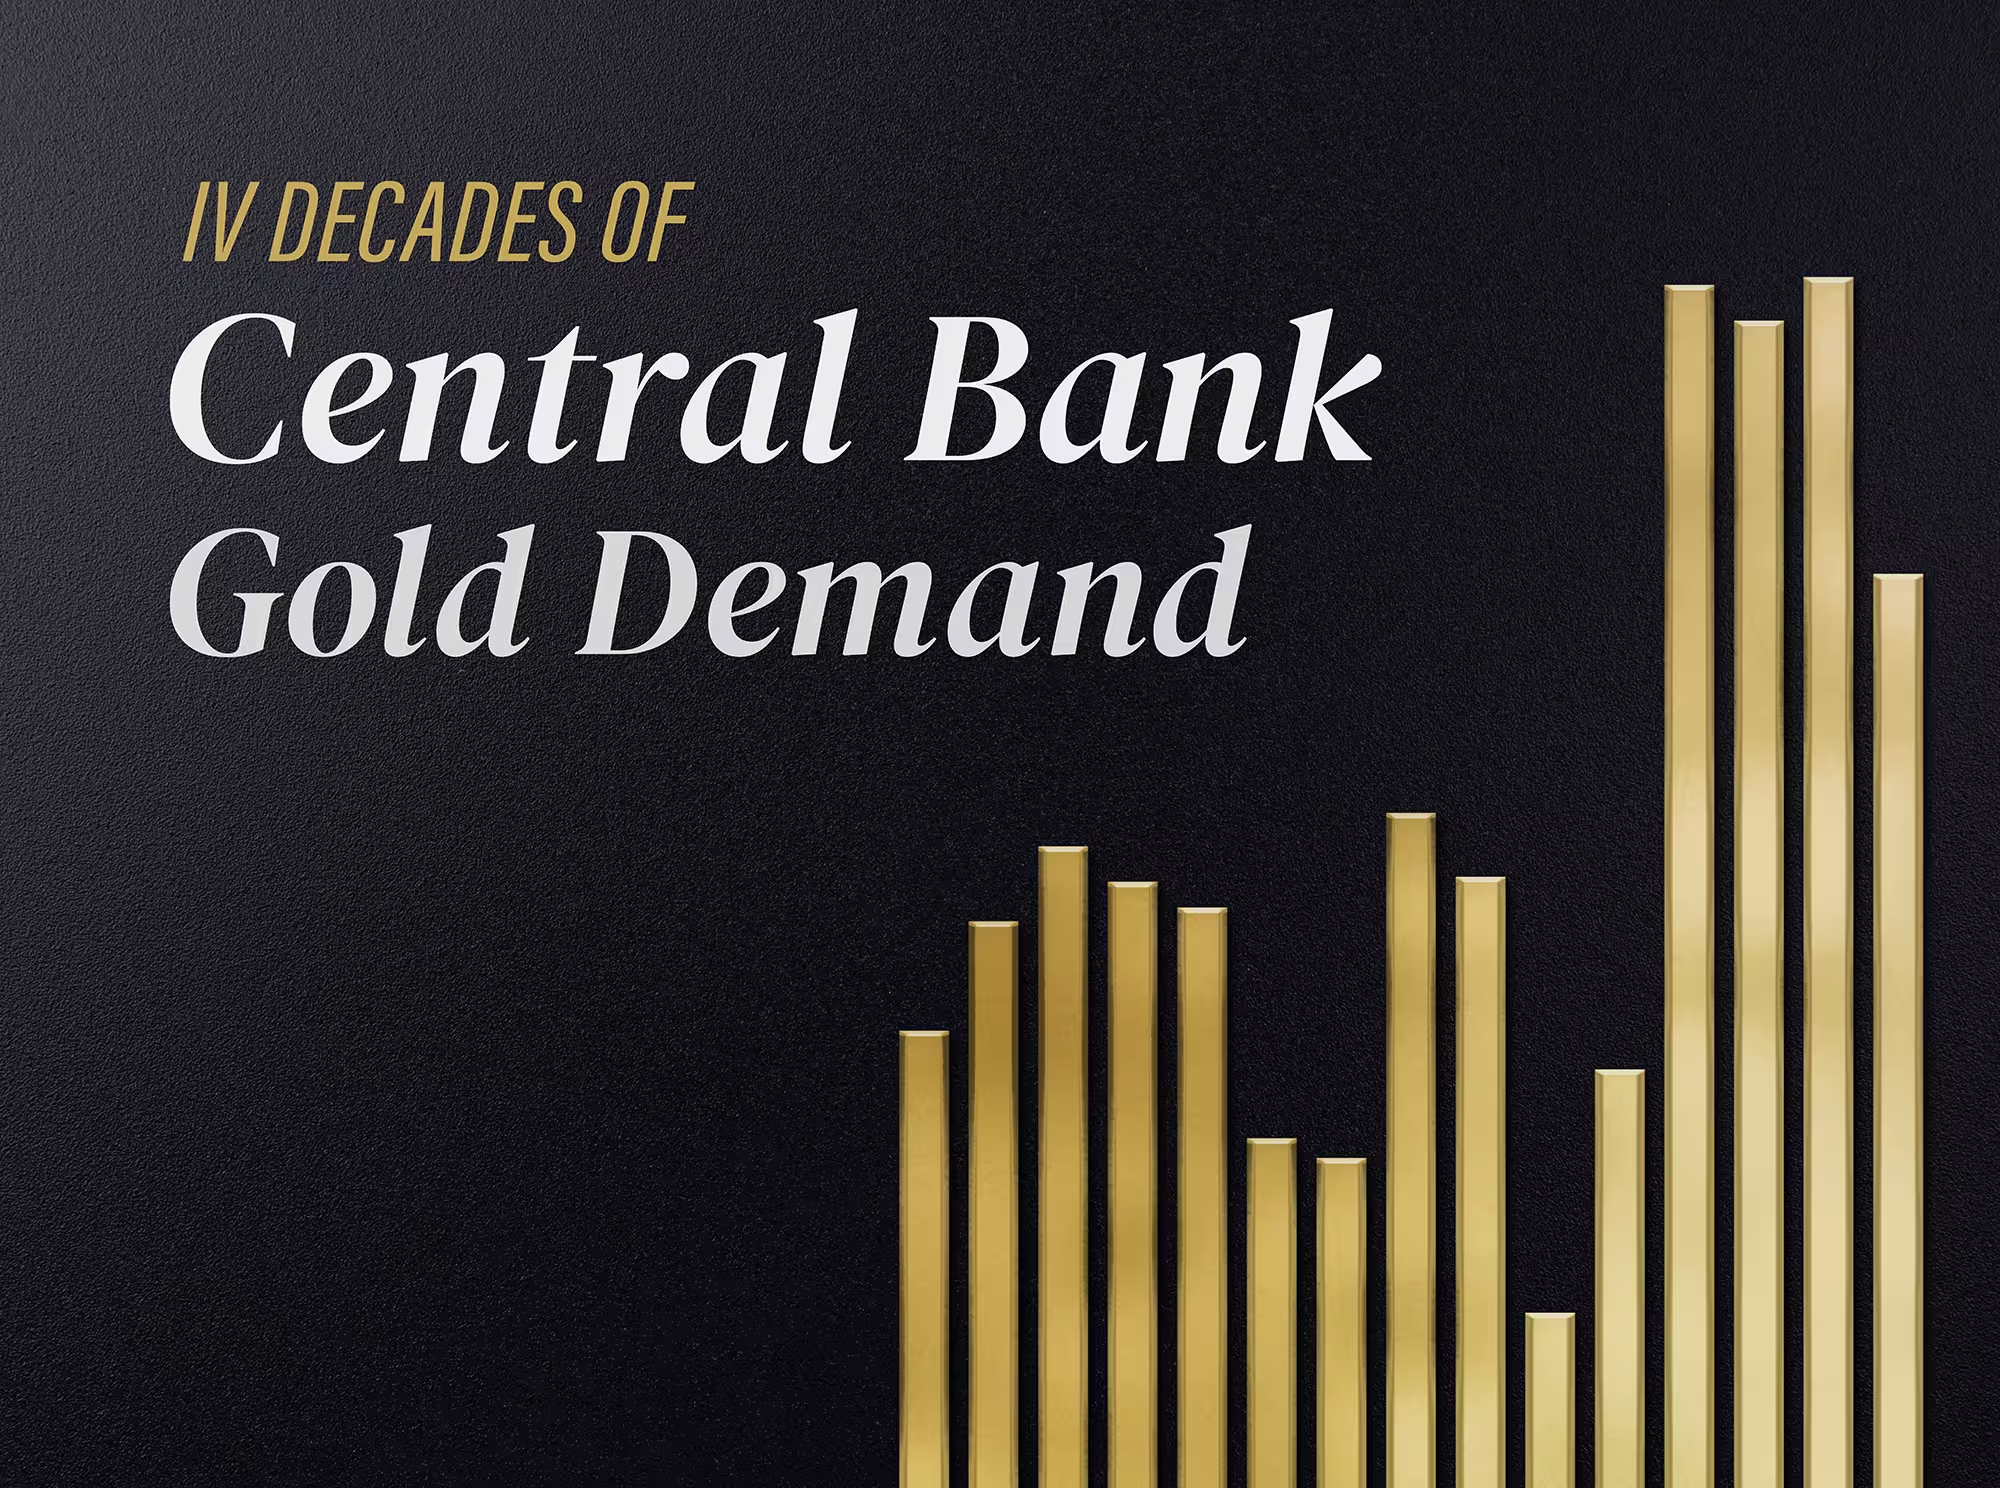
Central banks bought more gold between April and June 2026 than in any second quarter on record, according to a World Gold Council report published on July 30. That keeps them net buyers this year, as they have been every year since 2010. Underneath, the picture is changing. Russia and Türkiye, both big buyers in the past, have been selling.