Precious Metals
A Median New US Home Now Costs Less Than 100 Ounces of Gold
IN 63 YEARS OF DATA, A NEW US HOME HAS NEVER COST AS LITTLE GOLD AS IN THE PAST YEAR


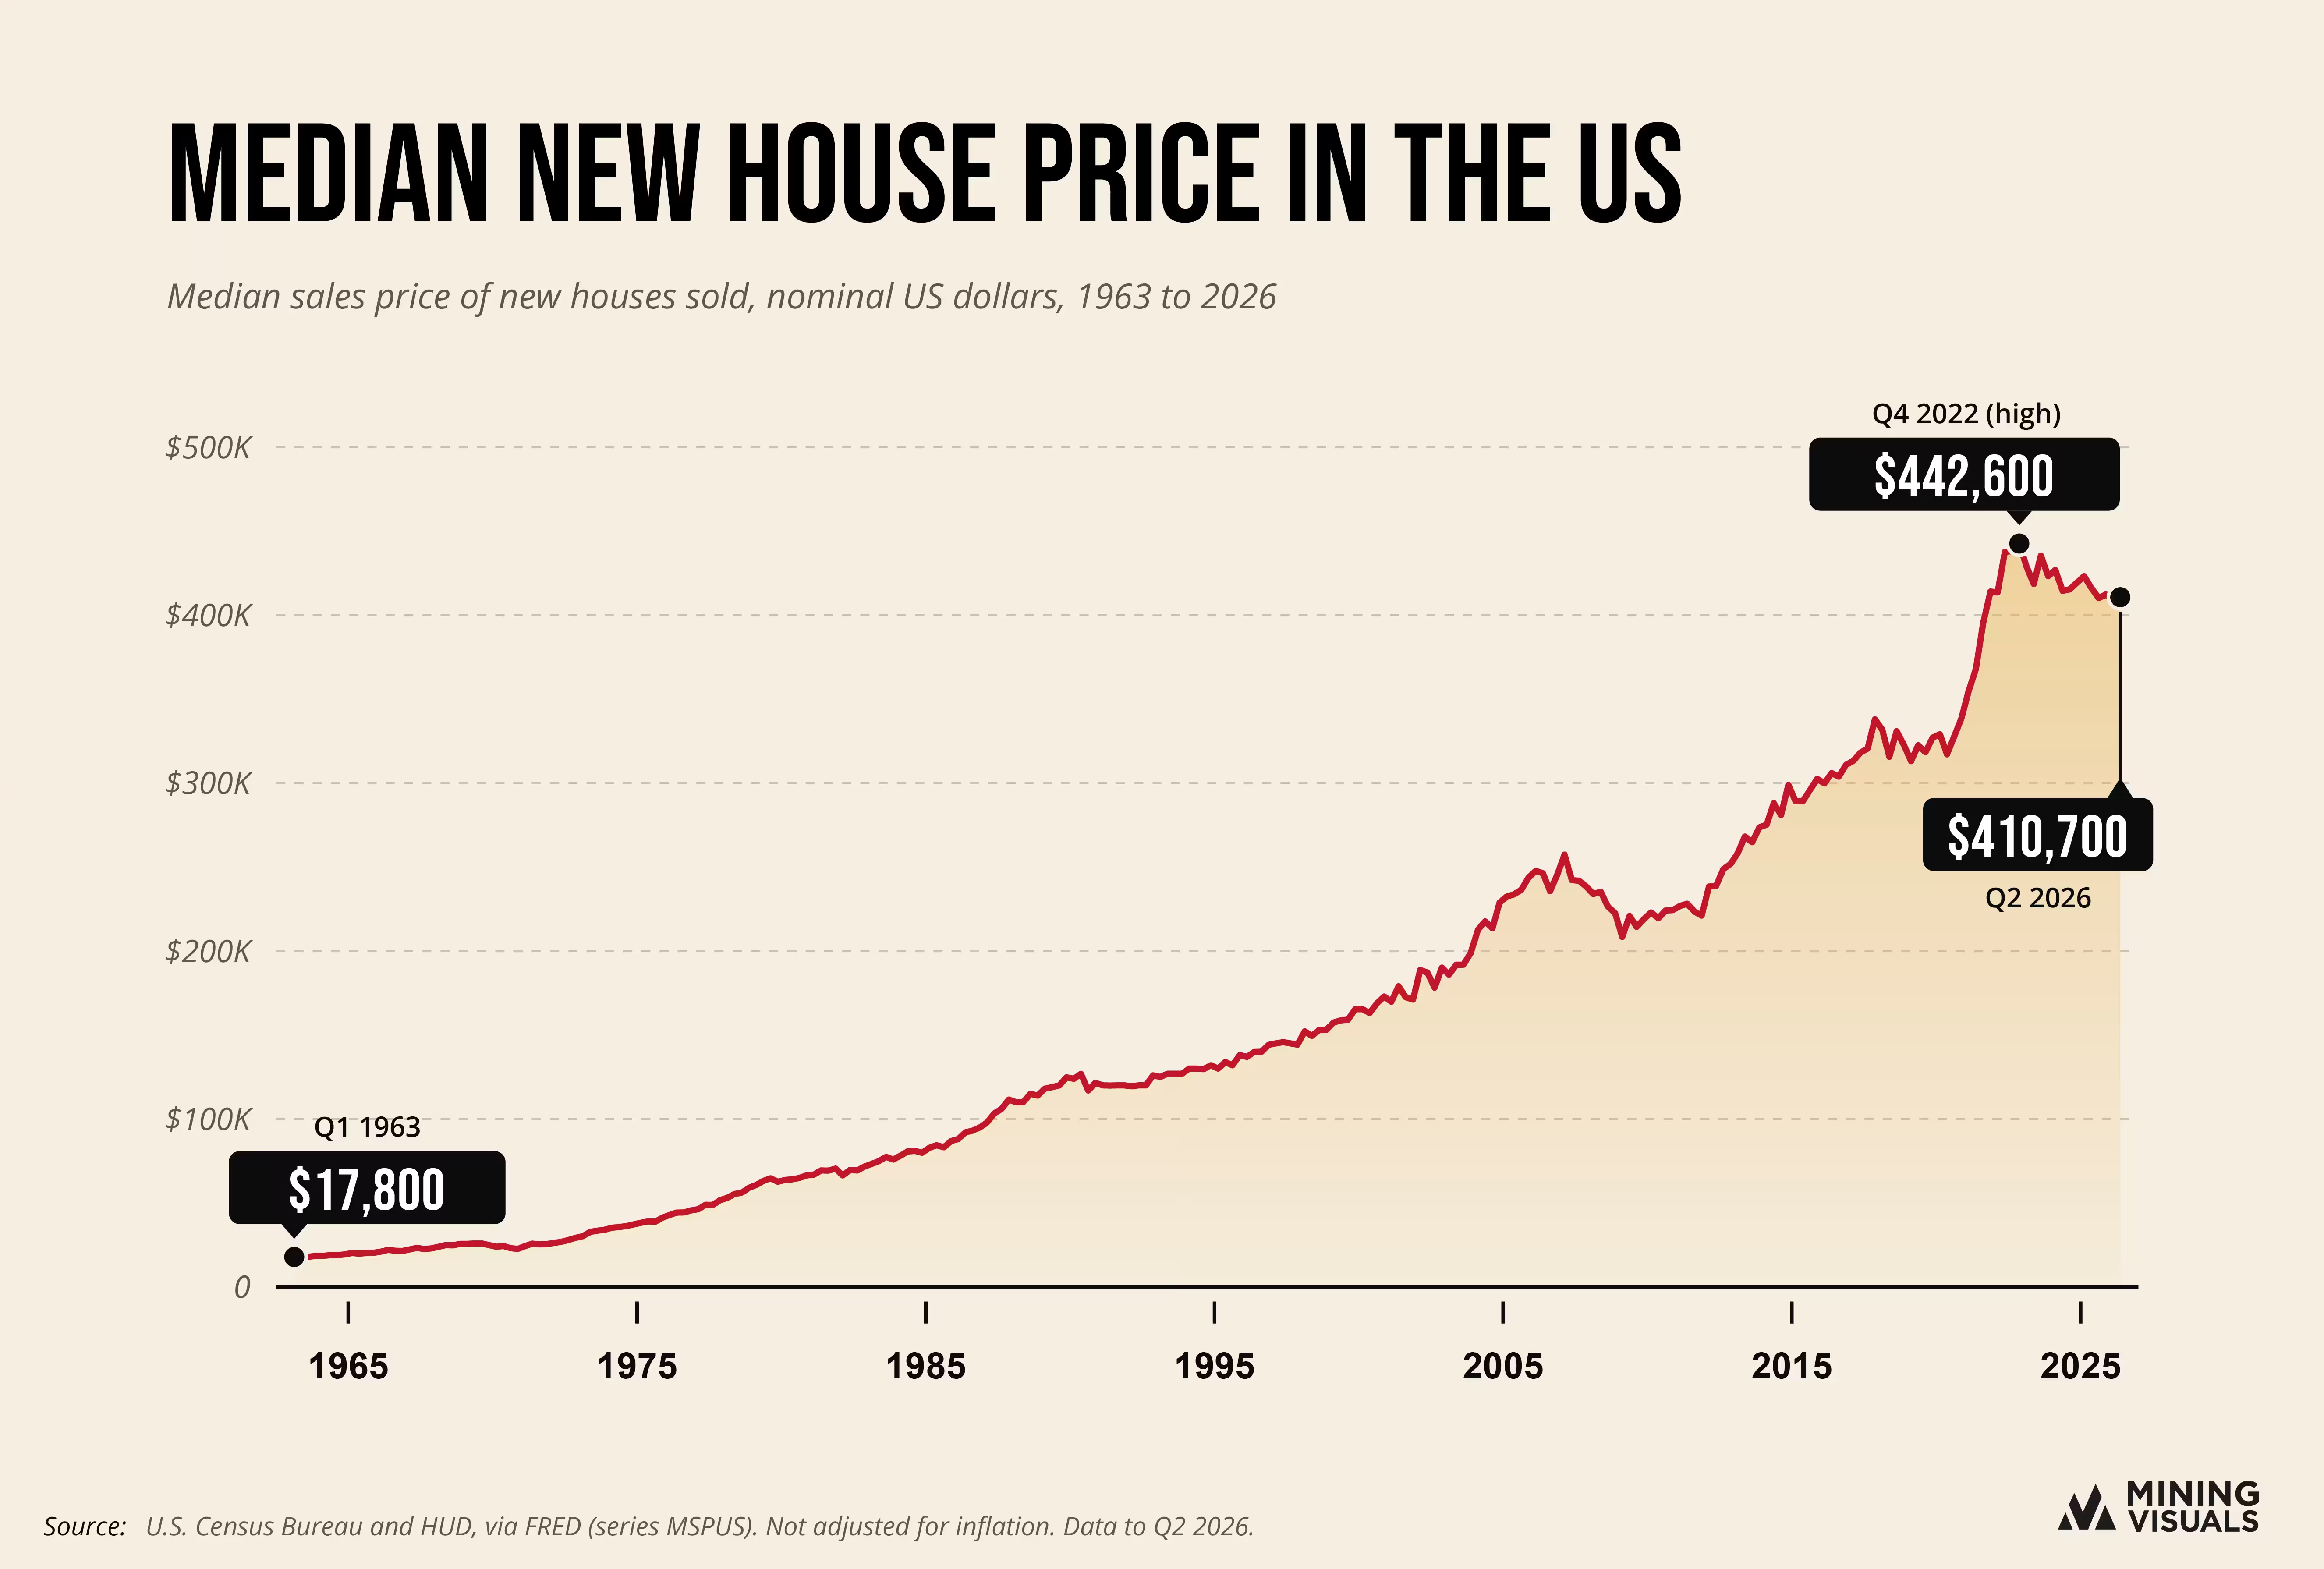
The US Census Bureau's July new-home report, released on August 25, put the median price of a newly built house at $393,800. HousingWire noted that was the lowest since July 2021. In dollars, the market has moved within a narrow band: the quarterly median has stayed between $408,500 and $435,400 since 2023. Priced in gold, it has not. Using the FRED data and World Bank gold prices behind the graphic above, Q4 2025 to Q2 2026 are the only quarters since 1963 in which a median new house cost less than 100 ounces.
In the 1960s, gold's price was set by governments, not by the market. Under the Bretton Woods system, US dollars could be exchanged for gold at $35 an ounce. From March 1968, only central banks traded at that price, while gold for everyone else started to trade at its own market price. That arrangement ended in August 1971, when the US stopped exchanging dollars for gold, according to the same Federal Reserve History essay.
With gold held close to $35, the number of ounces needed to buy a house rose because houses got more expensive. From Q1 1963 to Q2 1970, the median new house price rose 37%, while the average gold price rose only 2%, to $35.67. That is how the line climbed to its peak of 684 ounces.
Both deep troughs follow gold's record runs. Between Q2 1970 and Q3 1980, the median new house rose 166%, while the quarterly gold average rose about 18-fold. Gold set a record of $850 in January 1980, as high inflation, the Soviet intervention in Afghanistan and the Iranian revolution drove buying, according to Reuters.
The 2001 peak came after the opposite setting. Gold fell to $251.70 in August 1999 on worries about central-bank sales and miners selling forward, the same Reuters timeline shows. From Q2 2001 to Q3 2011, house prices rose 25% and gold 6.4-fold. That stretch ended in the quarter gold hit its September 2011 record of $1,920.
Over the year to Q2 2026, the median new house price fell 1.3%, while the average gold price rose 37%, from $3,293 to $4,512 an ounce, according to World Bank commodity price data. Gold also fell back from its record in early 2026: its Q2 average was lower than Q1's $4,876. That is the main reason a house cost 91 ounces in Q2, up from 84 in Q1.
The median new house price peaked at $442,600 in Q4 2022, according to FRED, and has eased since. Two things are holding it down. First, builders are cutting prices to find buyers. In August, about a third of US home builders (35%) cut their prices, by 6% on average, and nearly two-thirds (63%) offered buyers other incentives, according to a monthly survey by the National Association of Home Builders. Second, builders are building and selling more smaller, cheaper homes, which pulls the median price down. HousingWire reports that this shift explains much of the decline since 2022, and that builders are also using mortgage-rate buydowns, where the builder pays to lower the buyer's interest rate.
The Federal Reserve announces its rate decision on September 16. CME FedWatch shows 92% odds of a 25-basis-point hike, which would be the Fed's first increase since July 2023, HousingWire reports. In the same report, 30-year conforming mortgage rates averaged 7.28% on September 15.
FRED lists the next New Residential Sales release for September 24. For the third quarter so far, the World Bank puts July's average gold price at $4,073, and Census put July's median new-home price at $393,800.

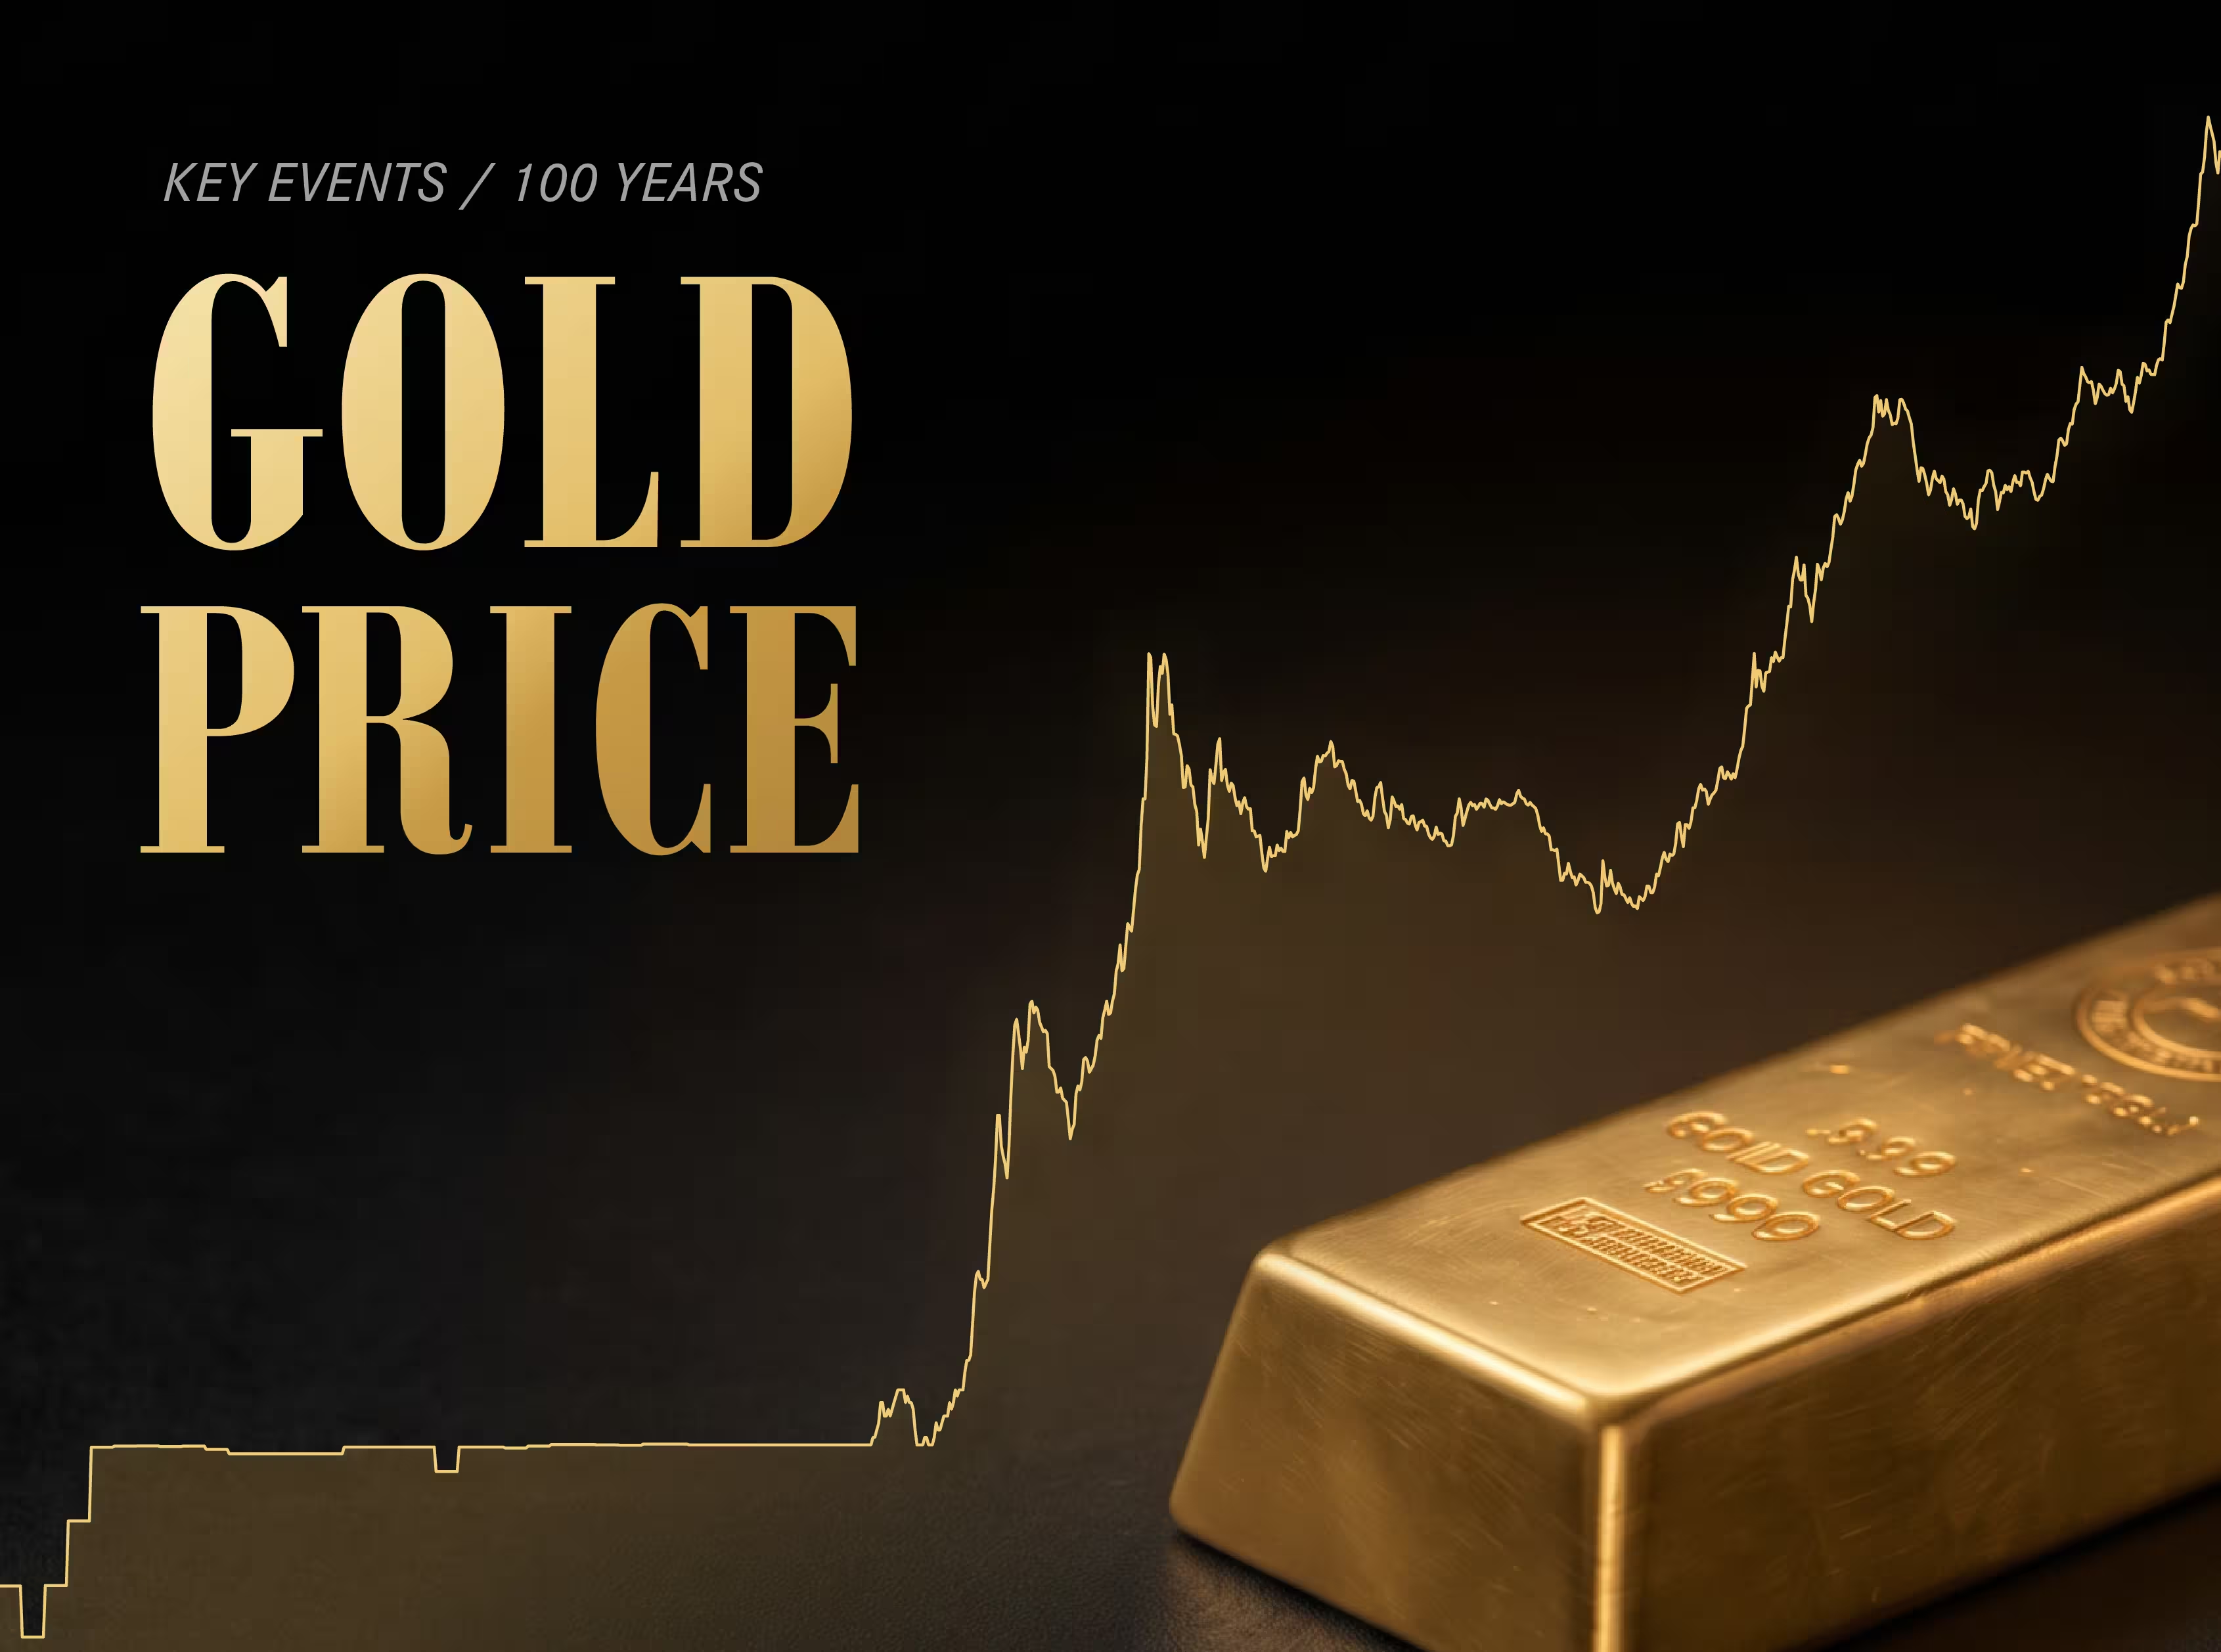
In 1934, the US government set the price of gold at $35 an ounce. In September 2026, the market price averaged $4,319. Measured in today's money, gold has done more than keep up with rising prices. An ounce is now worth almost five times what it was when the price was set in 1934, and more than at the famous 1980 peak. For the companies that mine it, that has meant record margins.

The largest silver producer among the world's primary silver mines in 2025 sat not in Mexico but in southwestern Bolivia. San Cristóbal, a large open-pit silver-zinc-lead mine run by Minera San Cristóbal, produced 17.6 million ounces of silver, narrowly ahead of Mexico's Juanicipio at the same rounded figure, in new Metals Focus data on the 20 largest primary silver mines. These are the operations where silver is a defining product rather than an incidental byproduct of lead, zinc and gold. The list runs from centuries-old mines in Mexico's silver belt to remote sites in the Andes, the Australian outback and the Alaskan wilderness. Eight of the 20 sit in Mexico, together about 44% of the total, while the rest are spread across the Americas, Asia, Africa and Australia.
Central banks bought more gold between April and June 2026 than in any second quarter on record, according to a World Gold Council report published on July 30. That keeps them net buyers this year, as they have been every year since 2010. Underneath, the picture is changing. Russia and Türkiye, both big buyers in the past, have been selling.

The nine West African countries with significant reported output produced about 15% of the world's mined gold in 2025, according to Metals Focus and World Gold Council data. Almost every mine on the map above was built in the past 25 years, and four more reached production in the last eighteen months: Lafigué in Côte d'Ivoire in June 2024, Kiaka in Burkina Faso in June 2025, Ahafo North in Ghana in October 2025 and Kiniero in Guinea in December 2025.