Precious Metals
October 24, 2024
1 min
Precious Metals
%20main.avif)

The price of gold and U.S. house prices have both risen significantly over time, but they follow different patterns based on economic factors such as inflation, demand, interest rates, and market sentiment. This infographic explores the price development of gold and housing from 1964 to 2024. Key events that have shaped both markets over the past six decades are listed below:
1960s-1970s: Economic Shifts and Inflation
- Gold: In 1971, the U.S. ended the gold standard, resulting in gold prices skyrocketing from $35/oz to $850/oz by 1980, fueled by inflation and economic instability.
- Housing: U.S. home prices steadily increased but were impacted by the high interest rates of the 1970s.
1980s: Diverging Paths
- Gold: Prices fell sharply after 1980 and remained stable in the $300-400/oz range.
- Housing: The real estate market boomed as inflation cooled, leading to consistent price growth.
2000-2010: Financial Crisis
- Gold: Surged past $1,900/oz during the 2008 financial crisis.
- Housing: Saw a dramatic downturn during the 2007-2008 crisis but began recovering by 2010.
2020-2024: Pandemic and Inflation
- Gold: Reached record highs above $2,000/oz as investors sought safe-haven assets.
- Housing: Prices surged during the pandemic, driven by low interest rates and demand, but slowed in 2023 due to rising rates.
This data demonstrates how gold typically thrives in times of economic uncertainty, while housing remains a stable, long-term investment.





Explore More
View All

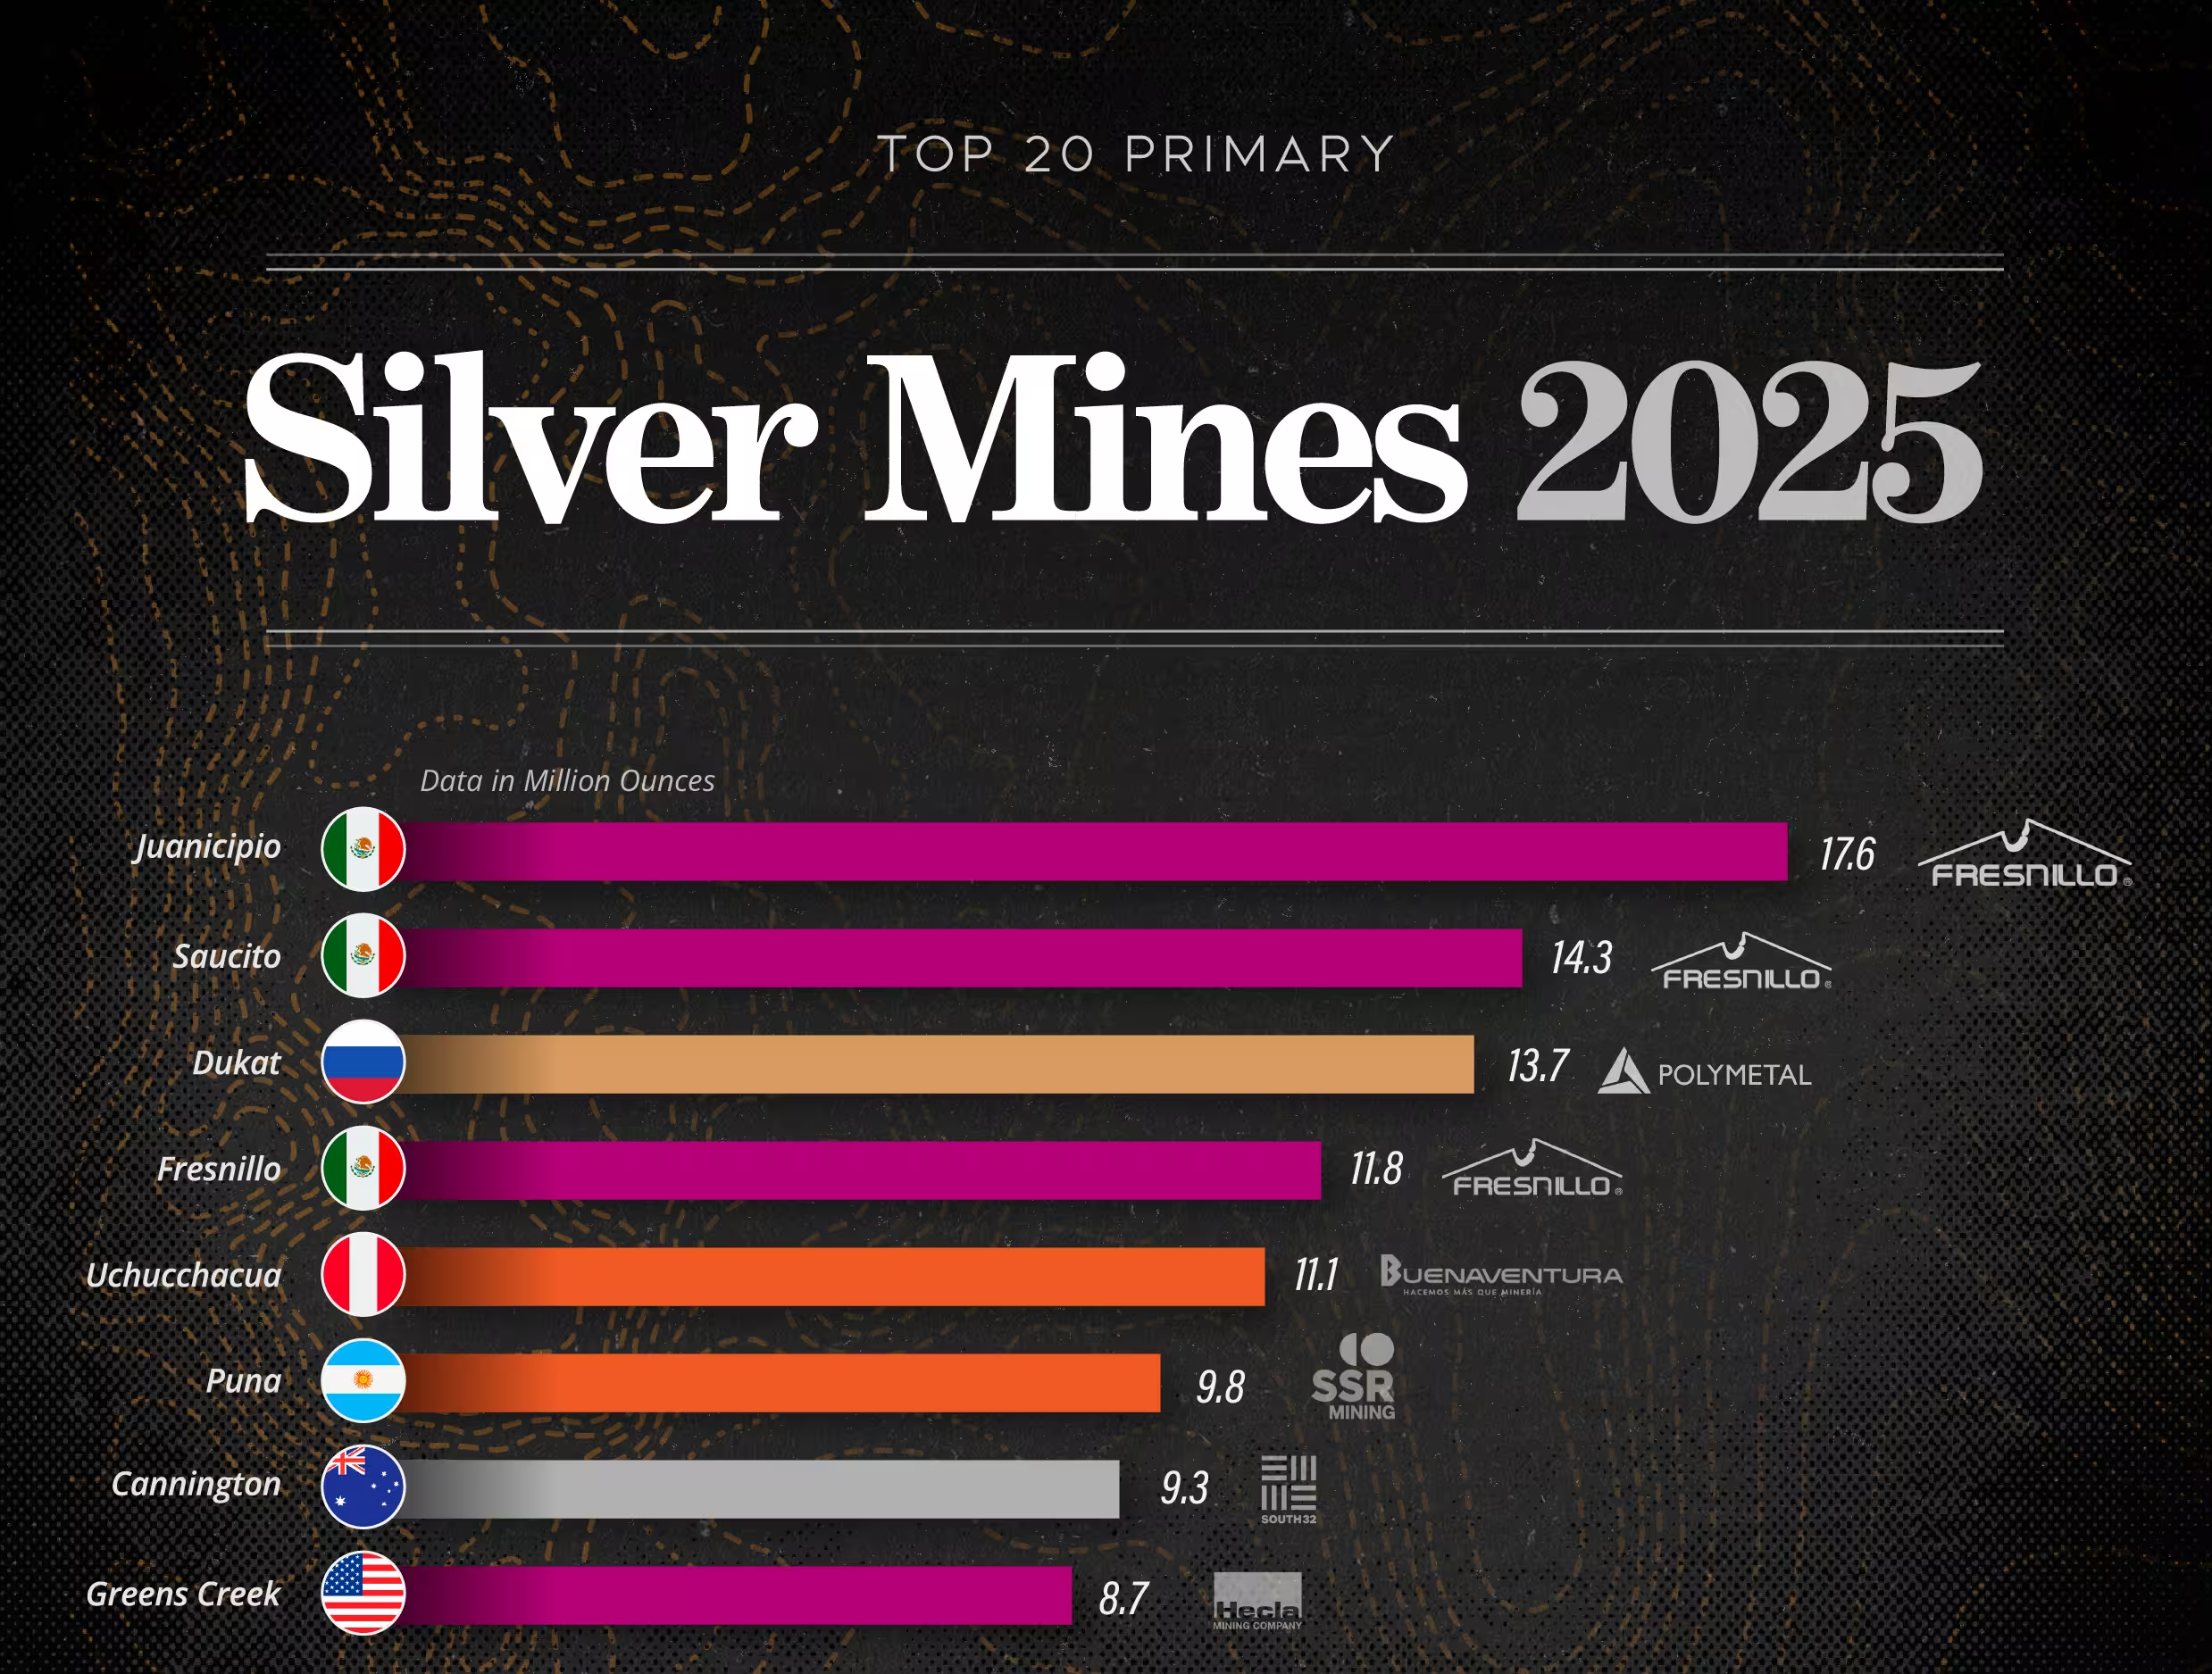
The World's 20 Largest Primary Silver Mines by 2025 Output
The World's 20 Largest Primary Silver Mines by 2025 Output
The single largest source of primary silver is a young mine in the Mexican state of Zacatecas. Juanicipio put out 17.6 million ounces in 2025, more than any other mine that earns its keep from silver itself rather than pulling it out as a byproduct of lead, zinc and gold. Fresnillo operates it and owns 56%; the other 44% changed hands in September 2025, when Pan American Silver completed a US$2.1 billion takeover of MAG Silver.
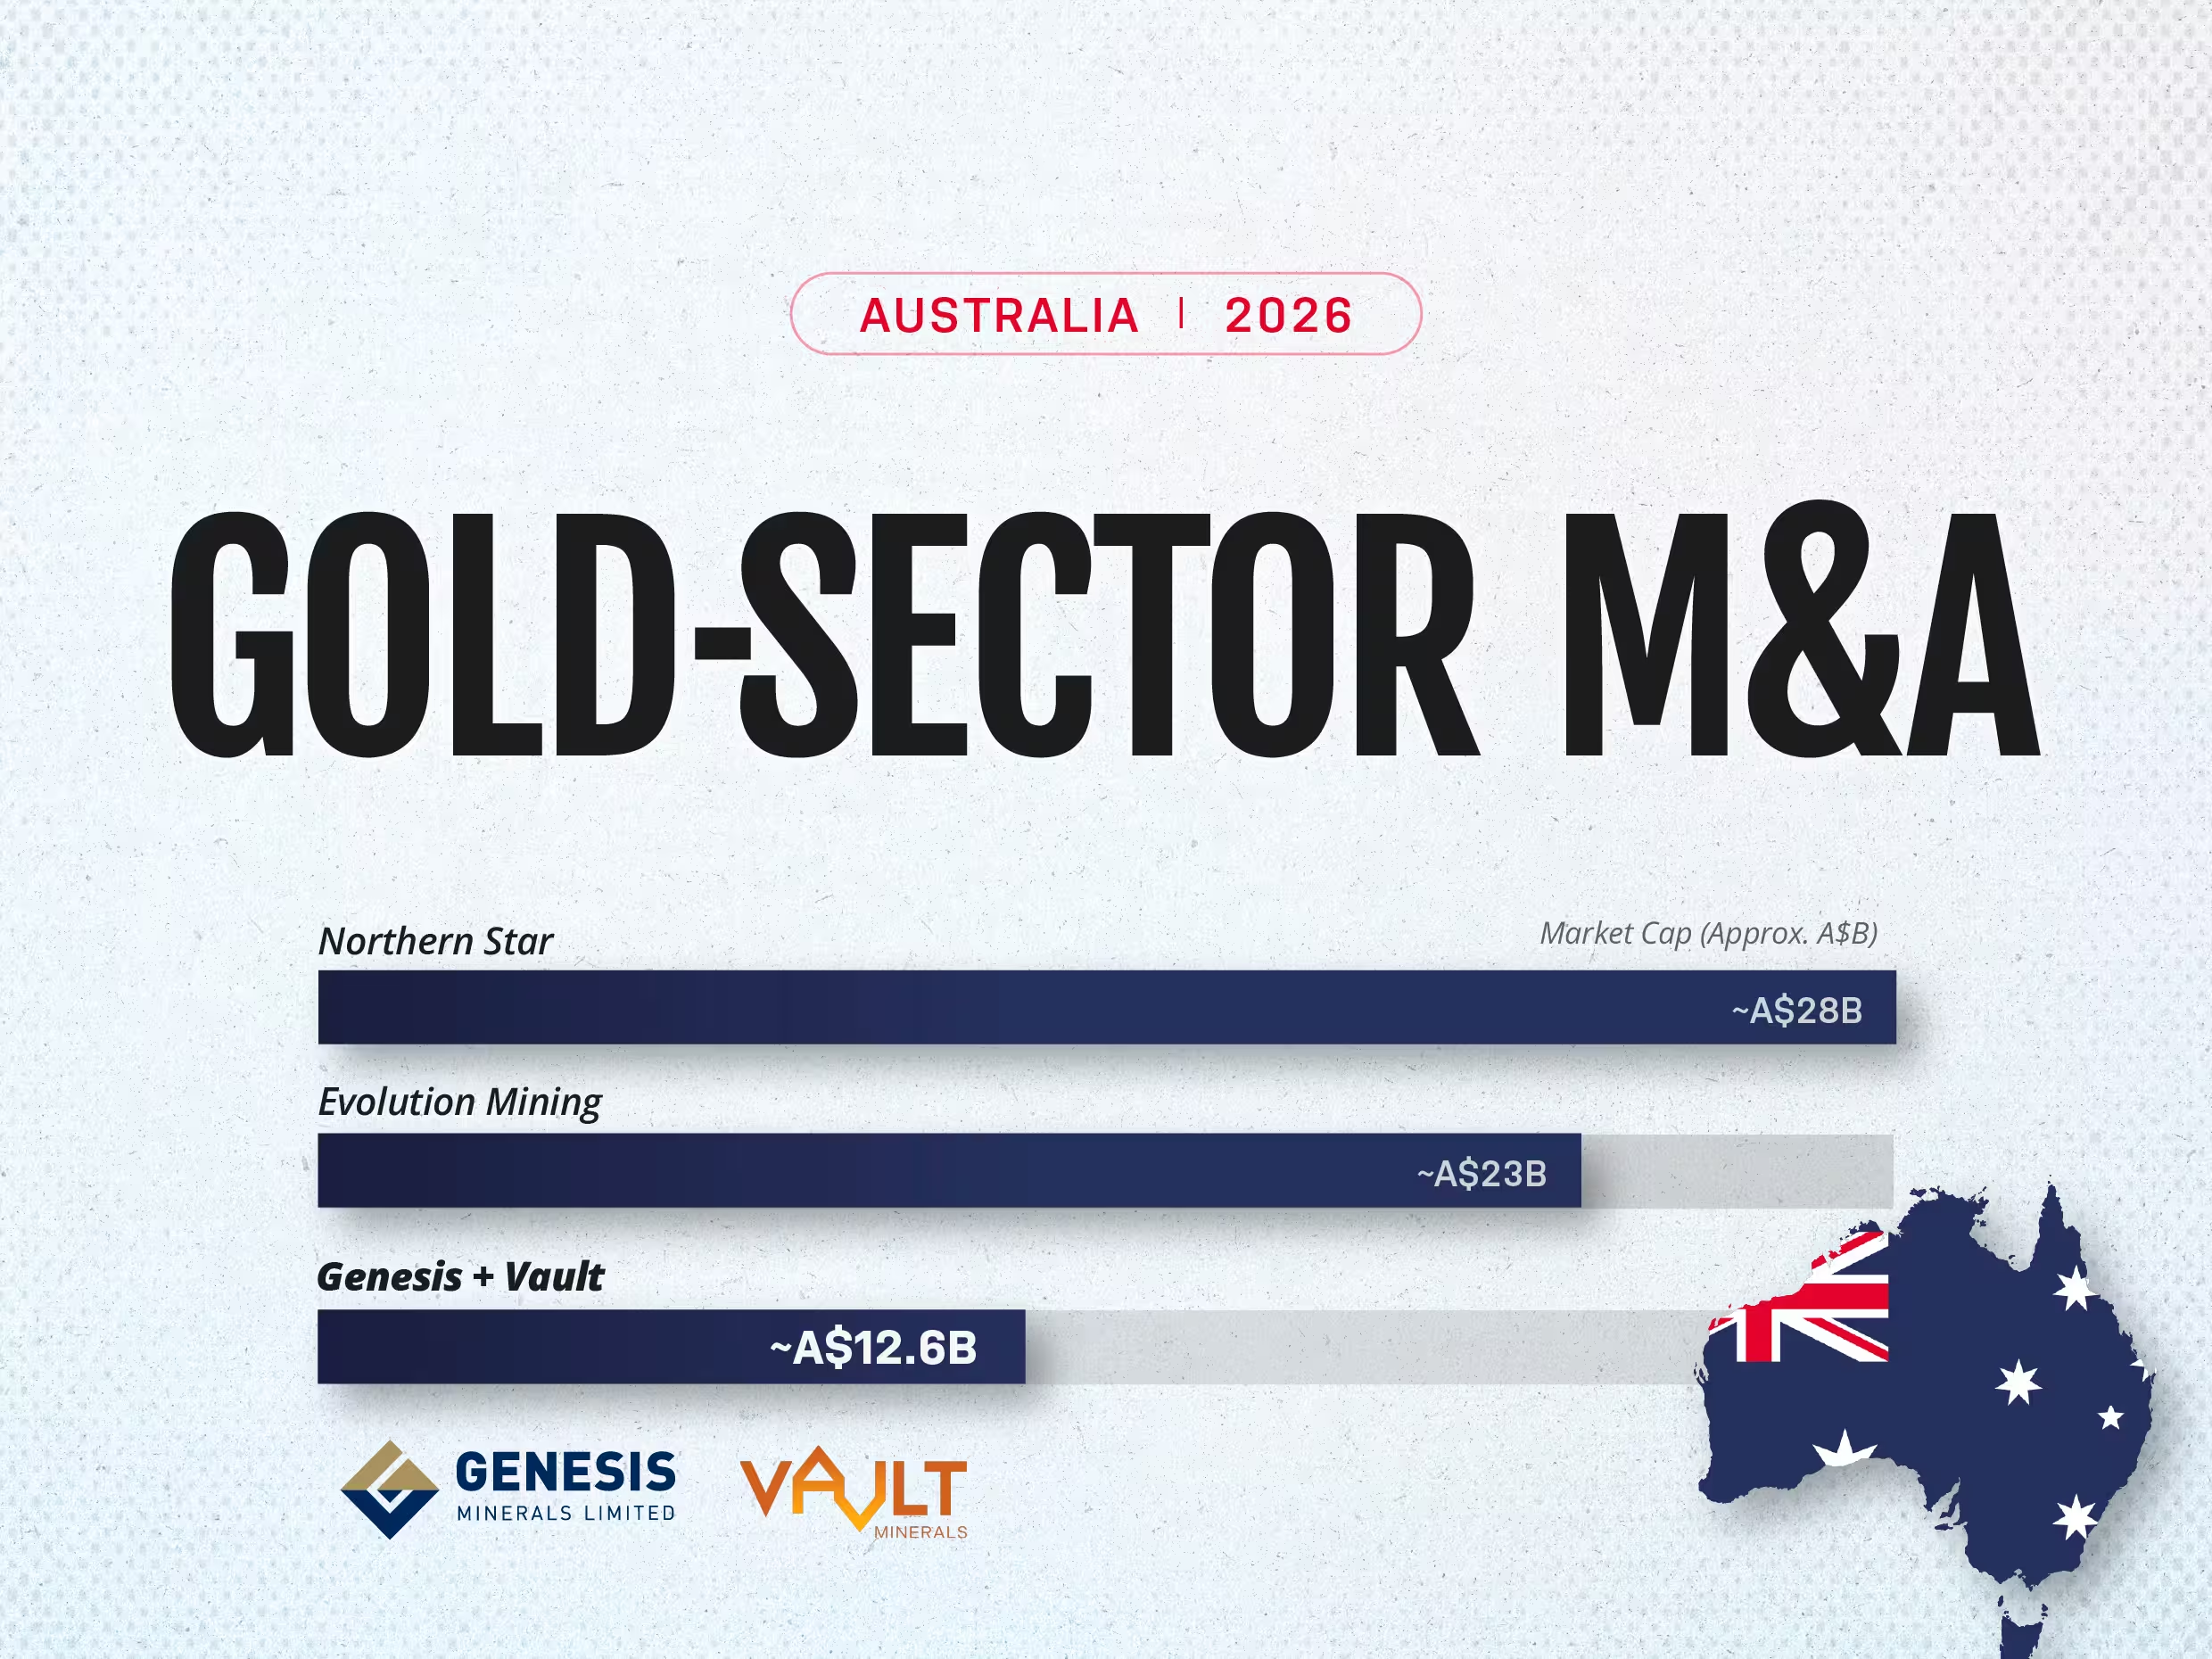
Gold's Record Run Has Set Off a Wave of Mining Mergers
Gold's Record Run Has Set Off a Wave of Mining Mergers
Gold hit an all-time high of about US$5,595 an ounce in January 2026 before settling near US$4,000, still far above the levels of a few years ago. That combination, record prices followed by a stable, still-profitable pullback, has done something a straight rally rarely does: it has opened a merger window.
.webp)
Three Ancient Belts Carry Ghana's Gold, and Investment Keeps Flowing to Them
Three Ancient Belts Carry Ghana's Gold, and Investment Keeps Flowing to Them
In March 2026, one of Ghana's own mining companies said it would invest about $1.2 billion in its operations at the Tarkwa and Damang gold mines. Both sit on the Ashanti belt, one of three narrow bands of ancient rock that carry almost all of Ghana's gold.
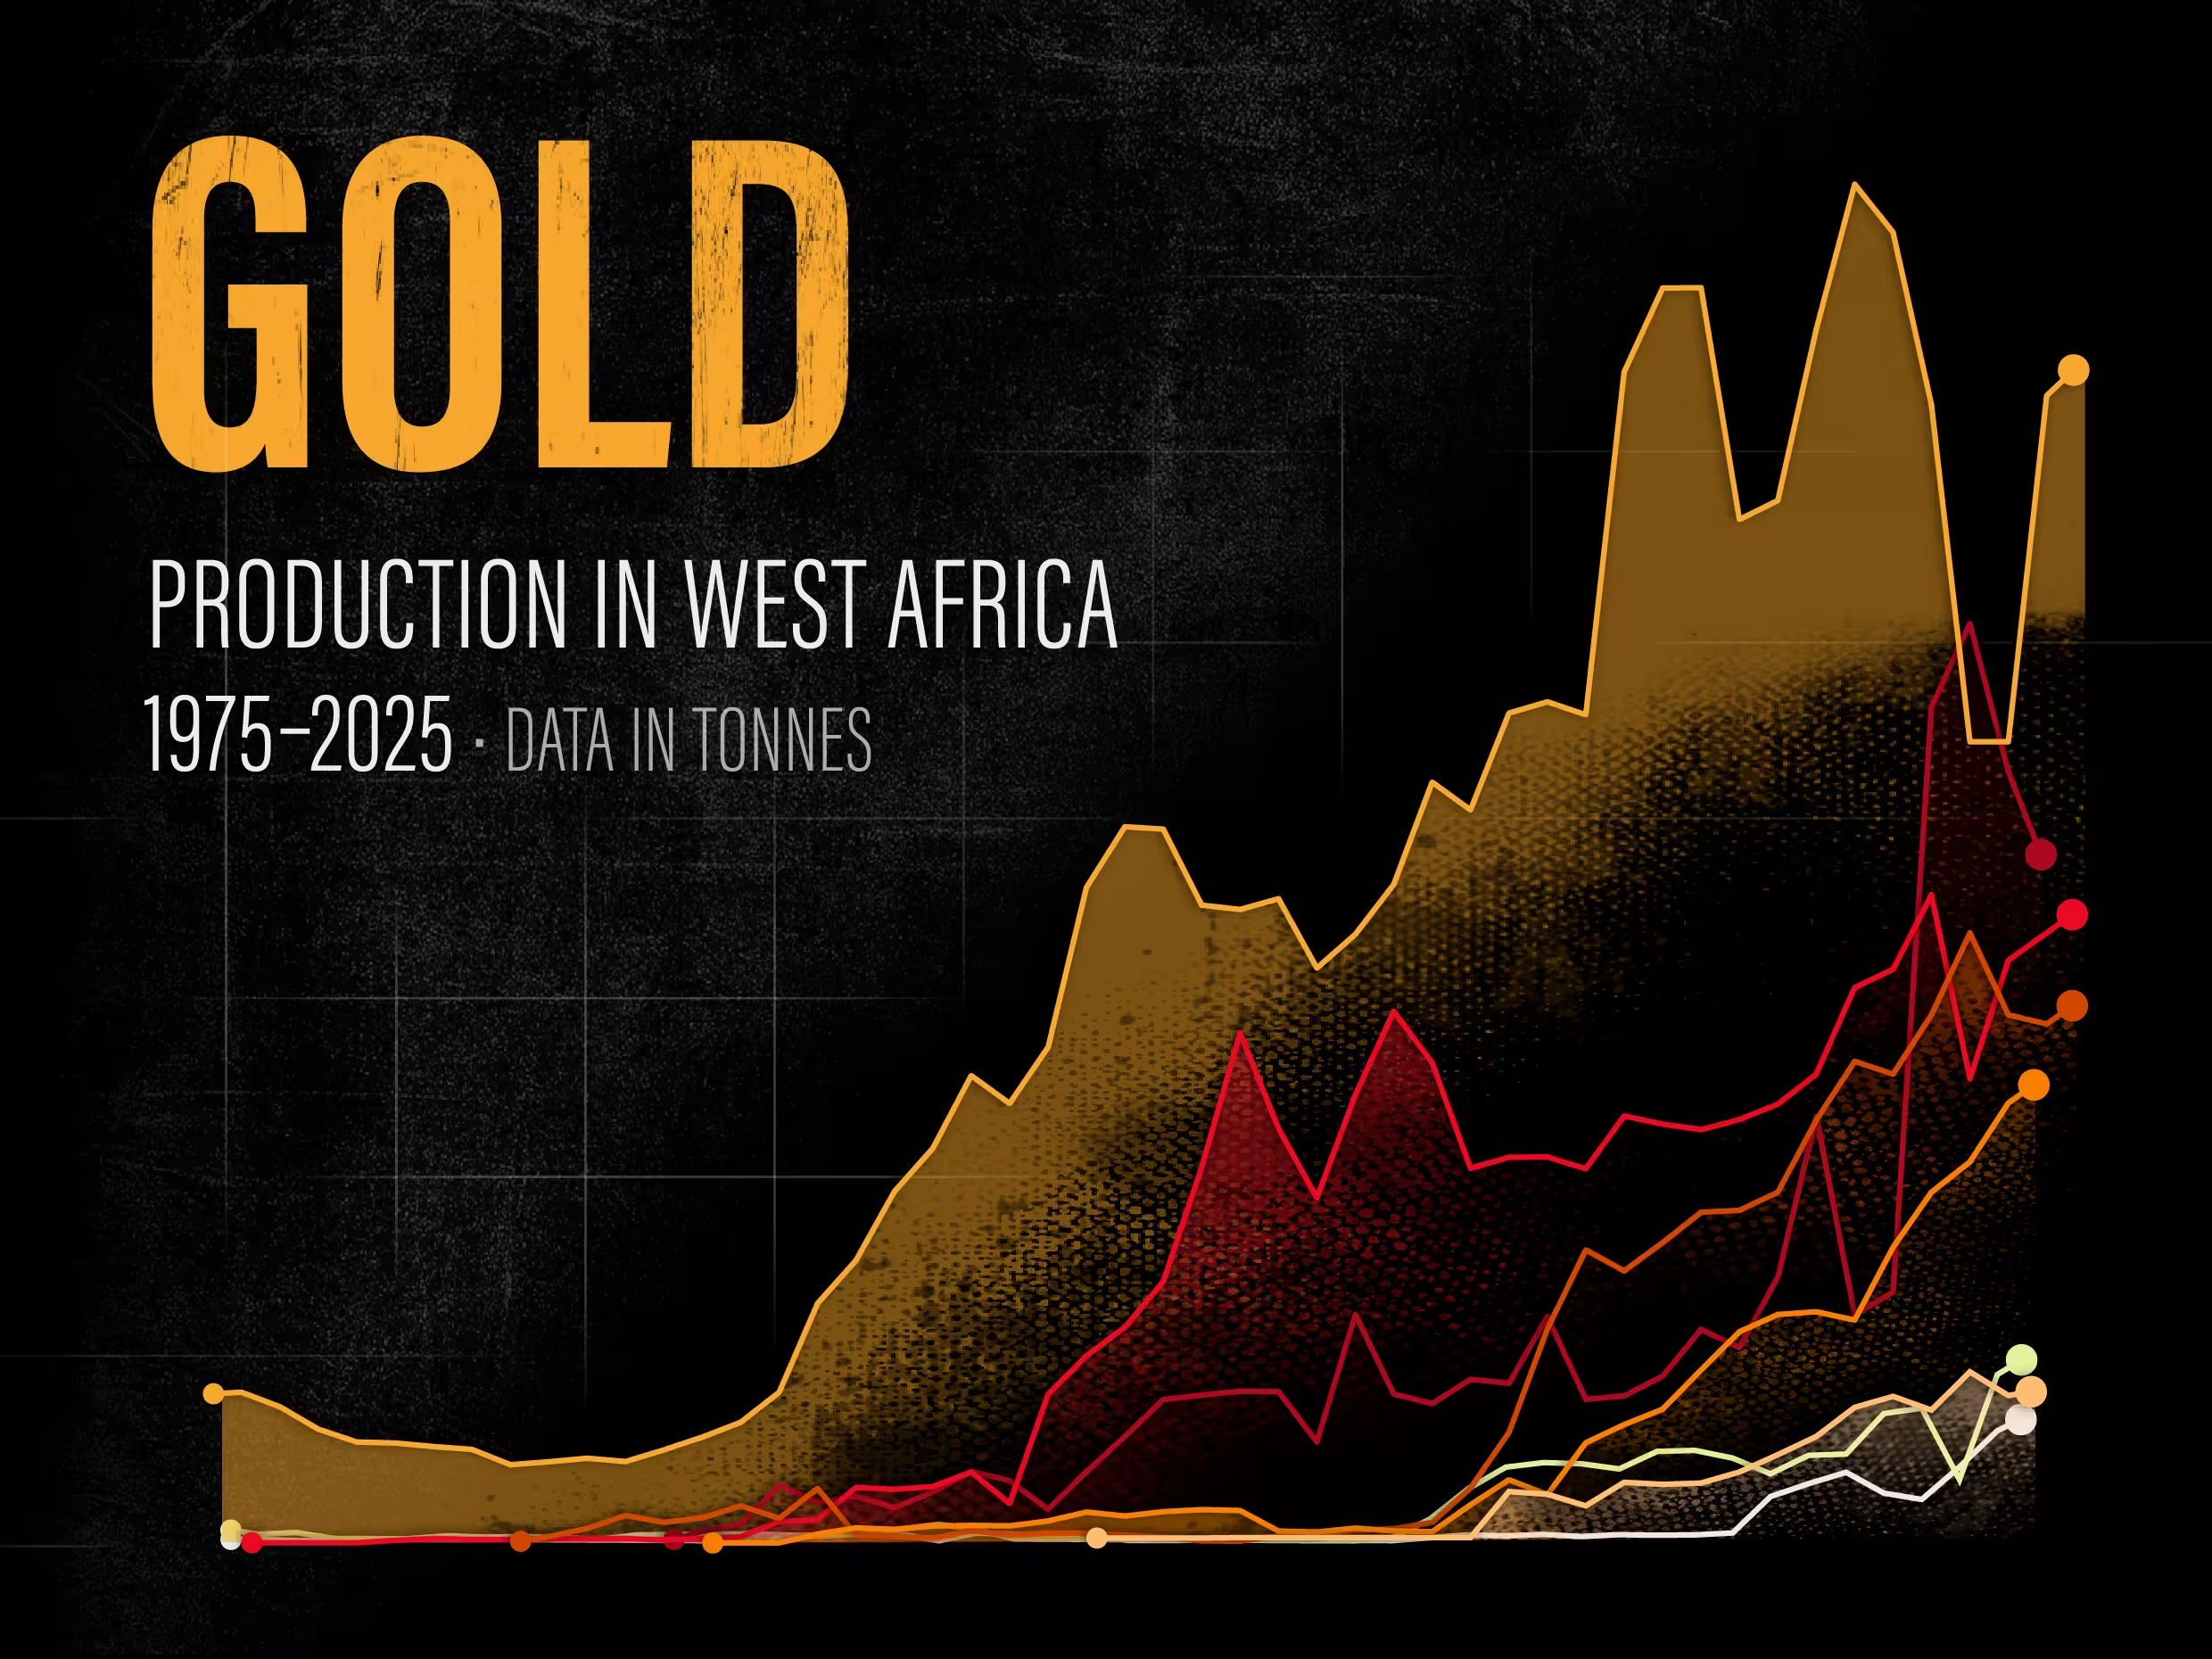
Charted: Fifty Years of Gold Production in West Africa
Charted: Fifty Years of Gold Production in West Africa
West Africa is in the middle of a gold run. In 2025 Ghana's output climbed more than 23 percent to a record 5.94 million ounces, holding its place as Africa's largest producer and now the sixth-largest in the world, and analysts expect the wider region to rebound about 8 percent in 2026.