Precious Metals
October 29, 2024
2 min
Precious Metals
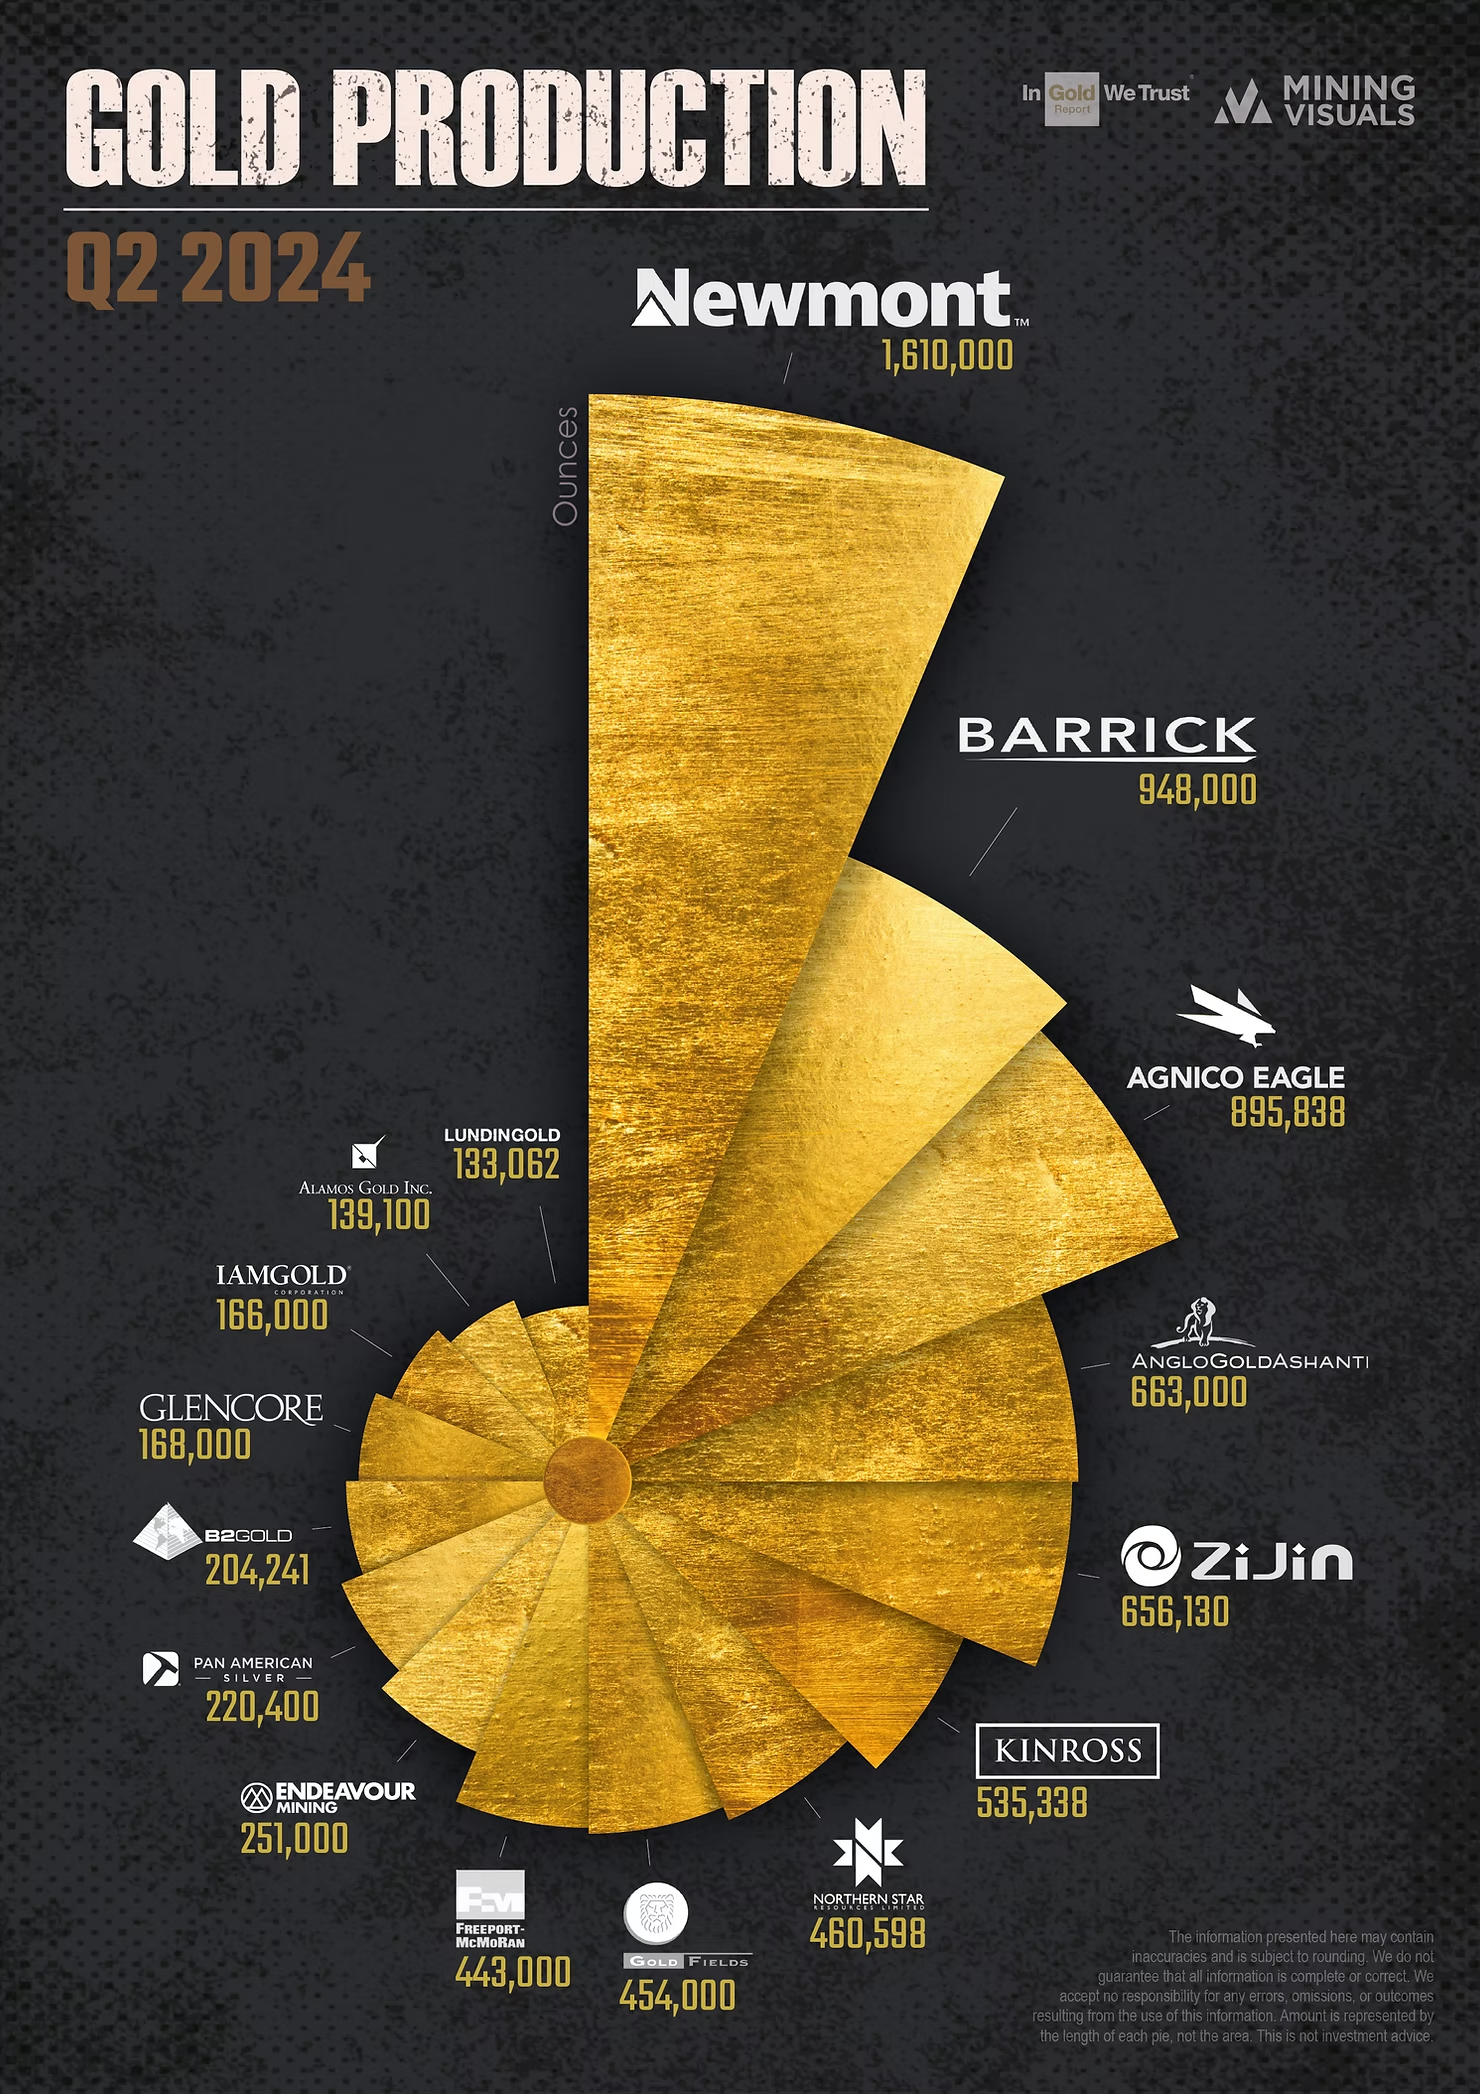

The second quarter of 2024 has shown dynamic shifts in gold production among major mining companies compared to the same period in 2023. Below is a closer look at how some of the leading gold producers performed, highlighting the top increases and decreases in production year-over-year.
Leaders in Production Growth
- Newmont Corporation reported a notable 29.84% increase in gold production, reaching 1,610,000 ounces in Q2 2024 compared to 1,240,000 ounces in Q2 2023.
- Iamgold Corp demonstrated the most impressive growth, with a 55.14% increase in production. The company produced 166,000 ounces in Q2 2024, up from 107,000 ounces in Q2 2023.
- Zijin Mining Group also saw a strong rise, increasing its production by 16.61% year-over-year. The company produced 656,130 ounces in Q2 2024 compared to 562,690 ounces in the same quarter last year, reinforcing its growth trajectory in the global market.
- Northern Star Resources production grew by 7.51% compared to Q2 2023.
Companies Facing Production Declines
- Gold Fields Ltd faced a significant production drop of 21.32%, with production falling to 454,000 ounces in Q2 2024 from 577,000 ounces in Q2 2023.
- Glencore PLC saw a 7.69% reduction in output, producing 168,000 ounces in Q2 2024 versus 182,000 ounces in Q2 2023.
- Barrick Gold Corp produced 948,000 ounces in Q2 2024, a 6.05% drop from the previous year’s 1,009,000 ounces.
- Endeavour Mining PLC also reported a decline of 6.34%, with production dropping from 268,000 ounces in Q2 2023 to 251,000 ounces in Q2 2024.
- B2Gold Corp - production decreased by 16.96%, dropping from 245,961 ounces to 204,241 ounces.
Companies with Stable Production or Marginal Changes
In contrast to the larger fluctuations seen across the industry, several companies maintained relatively stable gold production in Q2 2024, with only minor changes from the previous year. The companies with the smallest changes were:
- Agnico Eagle Mines Ltd (Ontario) – A modest increase of 2.59%, from 873,204 ounces to 895,838 ounces.
- Alamos Gold Inc – Production rose by 2.28%, moving from 136,000 ounces to 139,100 ounces.
- Lundin Gold Inc – Production grew by 2.57%, from 129,731 ounces to 133,062 ounces.
- Pan American Silver - Production declined by 1.28%, with production at 220,400 ounces, slightly down from 223,258 ounces in Q2 2023.
- Kinross Gold Corp experienced a slight decrease of 3.55%, from 555,036 ounces in Q2 2023 to 535,338 ounces in Q2 2024.
The information presented here may contain inaccuracies and is subject to rounding. We do not guarantee that all information is complete or correct. We accept no responsibility for any errors, omissions, or outcomes resulting from the use of this information. This is not investment advice.





Explore More
View All


The World's 20 Largest Primary Silver Mines by 2025 Output
The World's 20 Largest Primary Silver Mines by 2025 Output
The largest silver producer among the world's primary silver mines in 2025 sat not in Mexico but in southwestern Bolivia. San Cristóbal, a large open-pit silver-zinc-lead mine run by Minera San Cristóbal, produced 17.6 million ounces of silver, narrowly ahead of Mexico's Juanicipio at the same rounded figure, in new Metals Focus data on the 20 largest primary silver mines. These are the operations where silver is a defining product rather than an incidental byproduct of lead, zinc and gold. The list runs from centuries-old mines in Mexico's silver belt to remote sites in the Andes, the Australian outback and the Alaskan wilderness. Eight of the 20 sit in Mexico, together about 44% of the total, while the rest are spread across the Americas, Asia, Africa and Australia.

Central Banks Have Been Net Gold Buyers Since 2010, After Two Decades of Net Selling
Central Banks Have Been Net Gold Buyers Since 2010, After Two Decades of Net Selling
Central banks bought more gold between April and June 2026 than in any second quarter on record, according to a World Gold Council report published on July 30. That keeps them net buyers this year, as they have been every year since 2010. Underneath, the picture is changing. Russia and Türkiye, both big buyers in the past, have been selling.

Gold Mines in West Africa: Two Billion Years in the Making
Gold Mines in West Africa: Two Billion Years in the Making
The nine West African countries with significant reported output produced about 15% of the world's mined gold in 2025, according to Metals Focus and World Gold Council data. Almost every mine on the map above was built in the past 25 years, and four more reached production in the last eighteen months: Lafigué in Côte d'Ivoire in June 2024, Kiaka in Burkina Faso in June 2025, Ahafo North in Ghana in October 2025 and Kiniero in Guinea in December 2025.
A Median New US Home Now Costs Less Than 100 Ounces of Gold
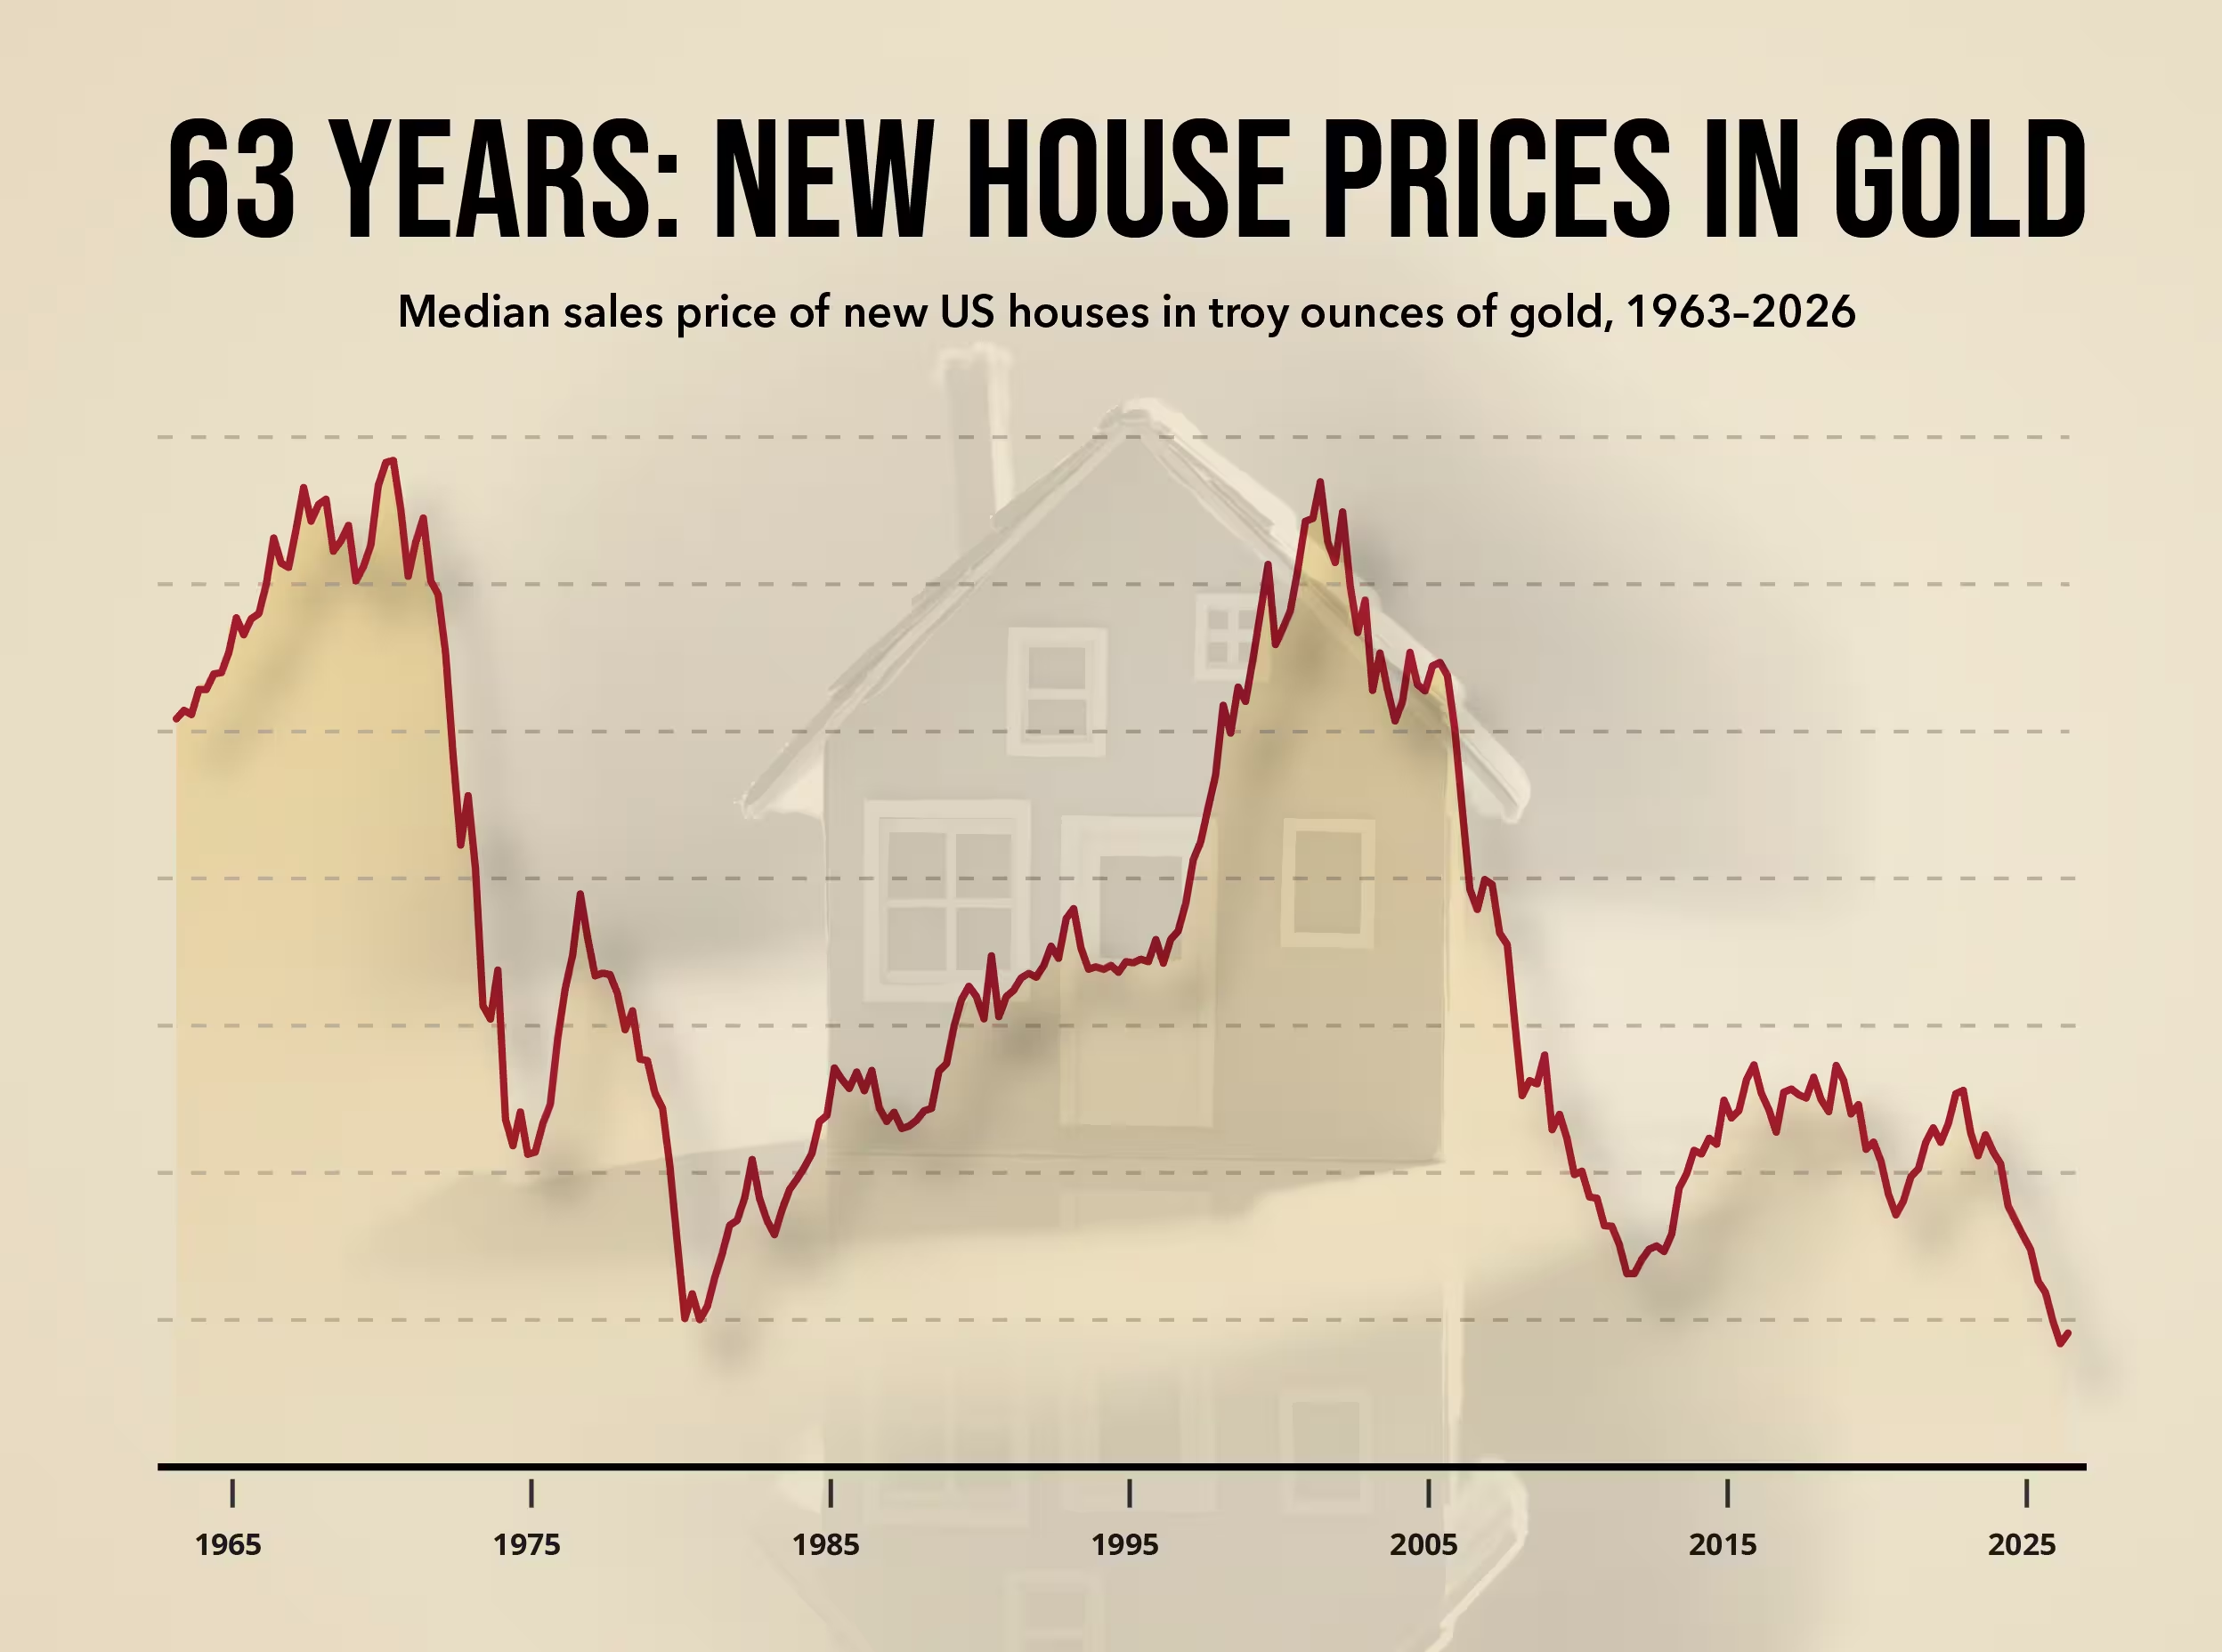
A Median New US Home Now Costs Less Than 100 Ounces of Gold
The US Census Bureau's July new-home report, released on August 25, put the median price of a newly built house at $393,800. HousingWire noted that was the lowest since July 2021. In dollars, the market has moved within a narrow band: the quarterly median has stayed between $408,500 and $435,400 since 2023.