Precious Metals
January 10, 2025
2 min
Precious Metals
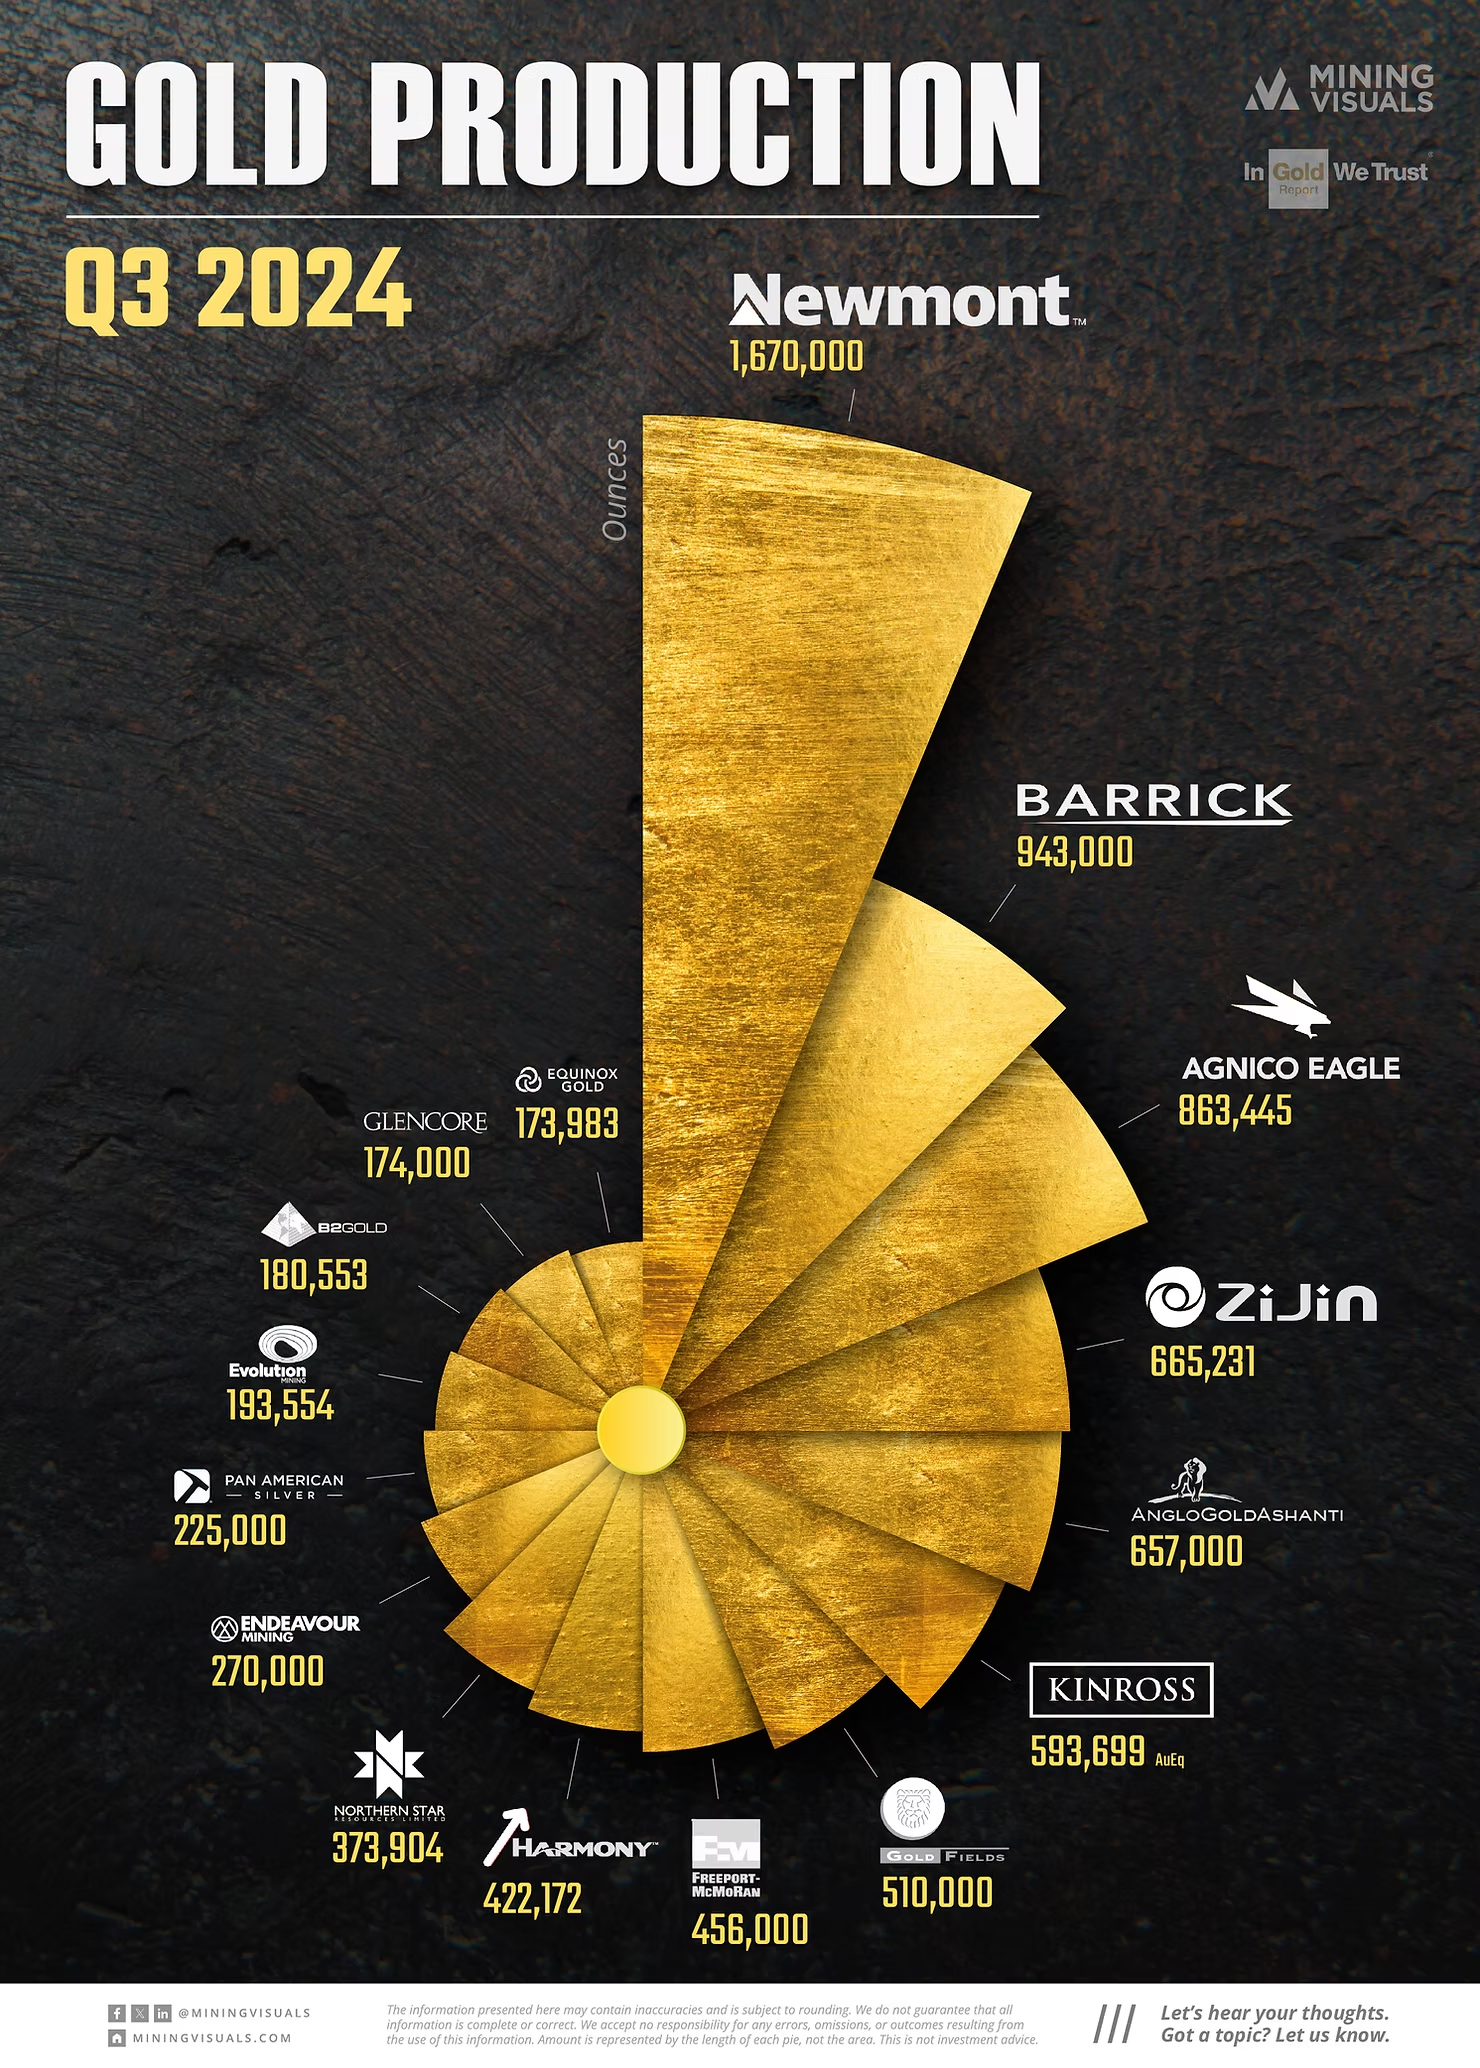

In this graphic and article, we examine gold production by the world's largest producers in Q3 2024, comparing it to the same period in 2023. Explore the shifts in production levels and the factors behind these changes.
Top Producers and Performance
- Newmont Corporation retained its top spot with 1,670,000 ounces, a significant 29.46% increase from Q3 2023. This growth came from higher output at the Cerro Negro mine in Argentina and the integration of Newcrest's assets, including the Lihir project.
- Barrick Gold Corp produced 943,000 ounces, down 9.24% due to lower output at its Nevada operations (Carlin and Cortez mines). However, Barrick expects a stronger Q4 to meet its full-year target.
- Agnico Eagle Mines Ltd showed a modest 1.53% growth, producing 863,445 ounces, maintaining steady output.
Growth Leaders
- Evolution Mining Ltd saw a 22.27% increase, reaching 193,554 ounces due to operational improvements at Red Lake in Ontario and higher-grade ore processing.
- Equinox Gold Corp posted 16.70% growth with 173,983 ounces, driven by the ramp-up of the Greenstone Mine.
- Zijin Mining Group continued its upward trend, increasing output by 6.24% to 665,231 ounces.
Declines Among Major Players
- Freeport-McMoRan Inc had the steepest decline, with a 14.29% drop to 456,000 ounces due to lower ore grades.
- B2Gold Corp's production fell by 25.65% to 180,553 ounces, mainly due to delays in accessing high-grade ore, equipment issues, and adverse weather at its Fekola Mine.
- AngloGold Ashanti PLC and Gold Fields Ltd reported moderate declines of 2.81% and 5.90%, respectively.
Steady Performers
- Kinross Gold Corp (593,699 ounces, +1.41%) and Northern Star Resources Ltd (373,904 ounces, +1.33%) maintained consistent production with stable operations.
Source: Company reports




Explore More
View All

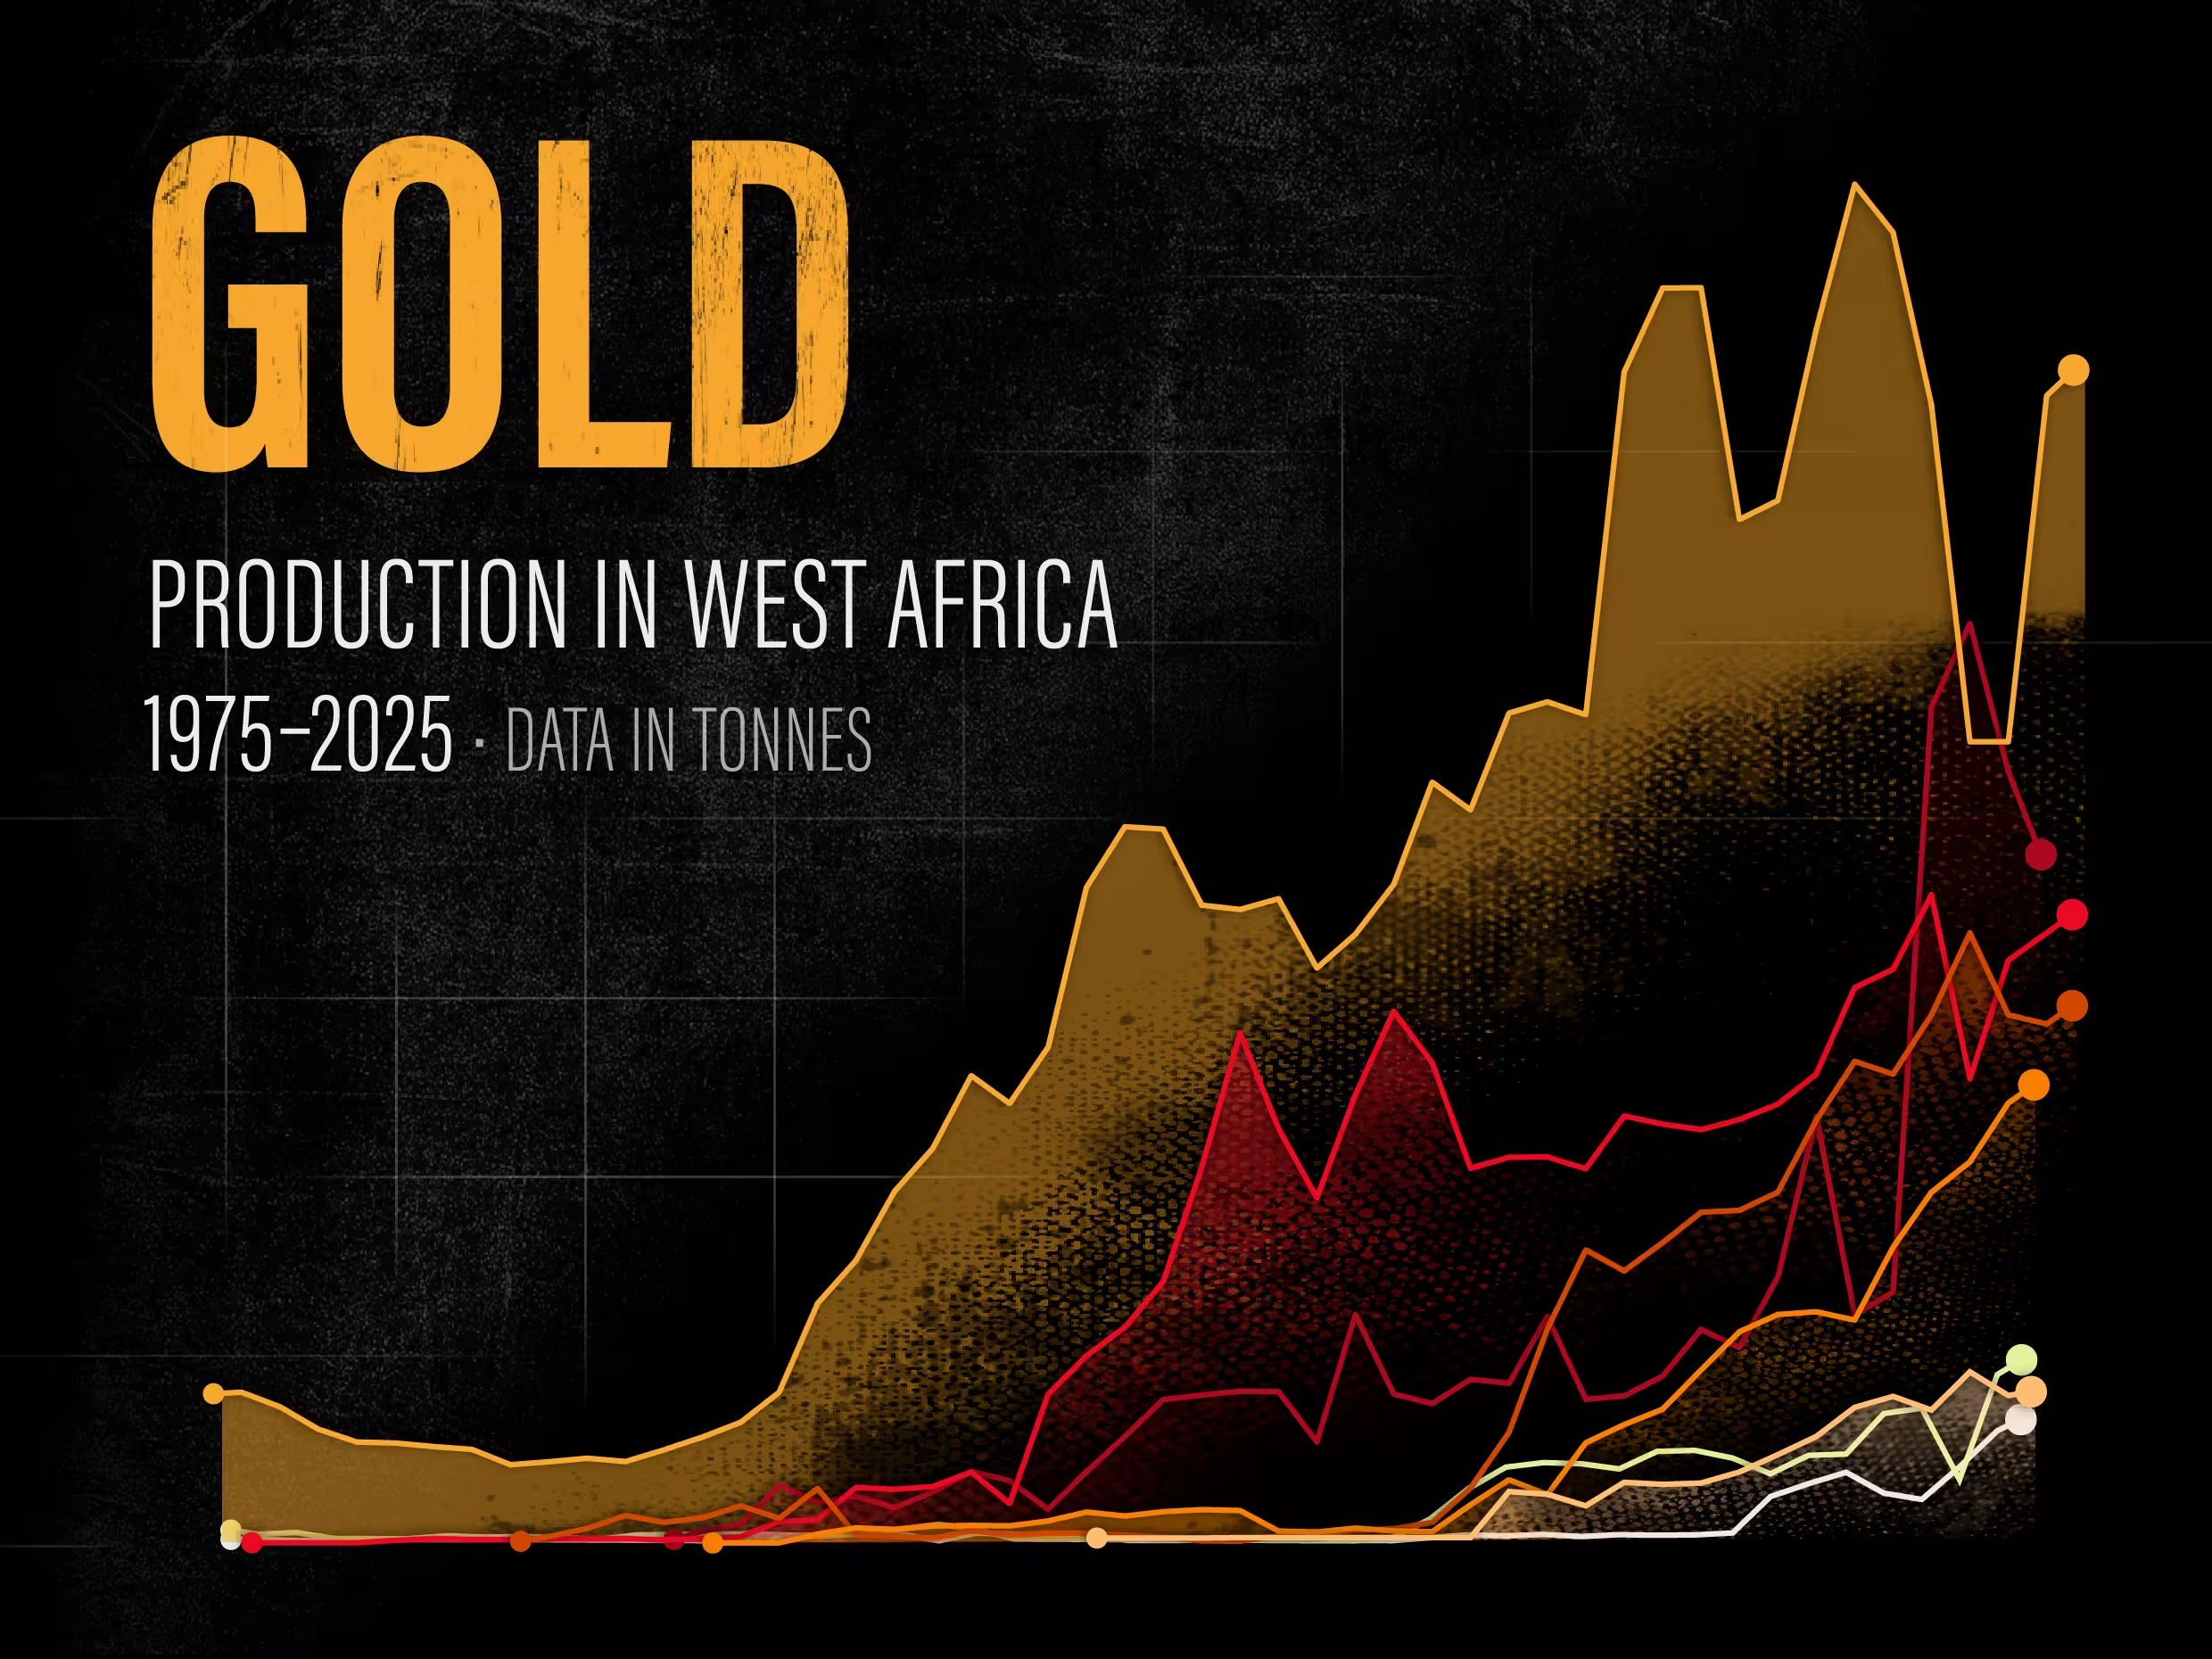
Charted: Fifty Years of Gold Production in West Africa
Charted: Fifty Years of Gold Production in West Africa
West Africa is in the middle of a gold run. In 2025 Ghana's output climbed more than 23 percent to a record 5.94 million ounces, holding its place as Africa's largest producer and now the sixth-largest in the world, and analysts expect the wider region to rebound about 8 percent in 2026.
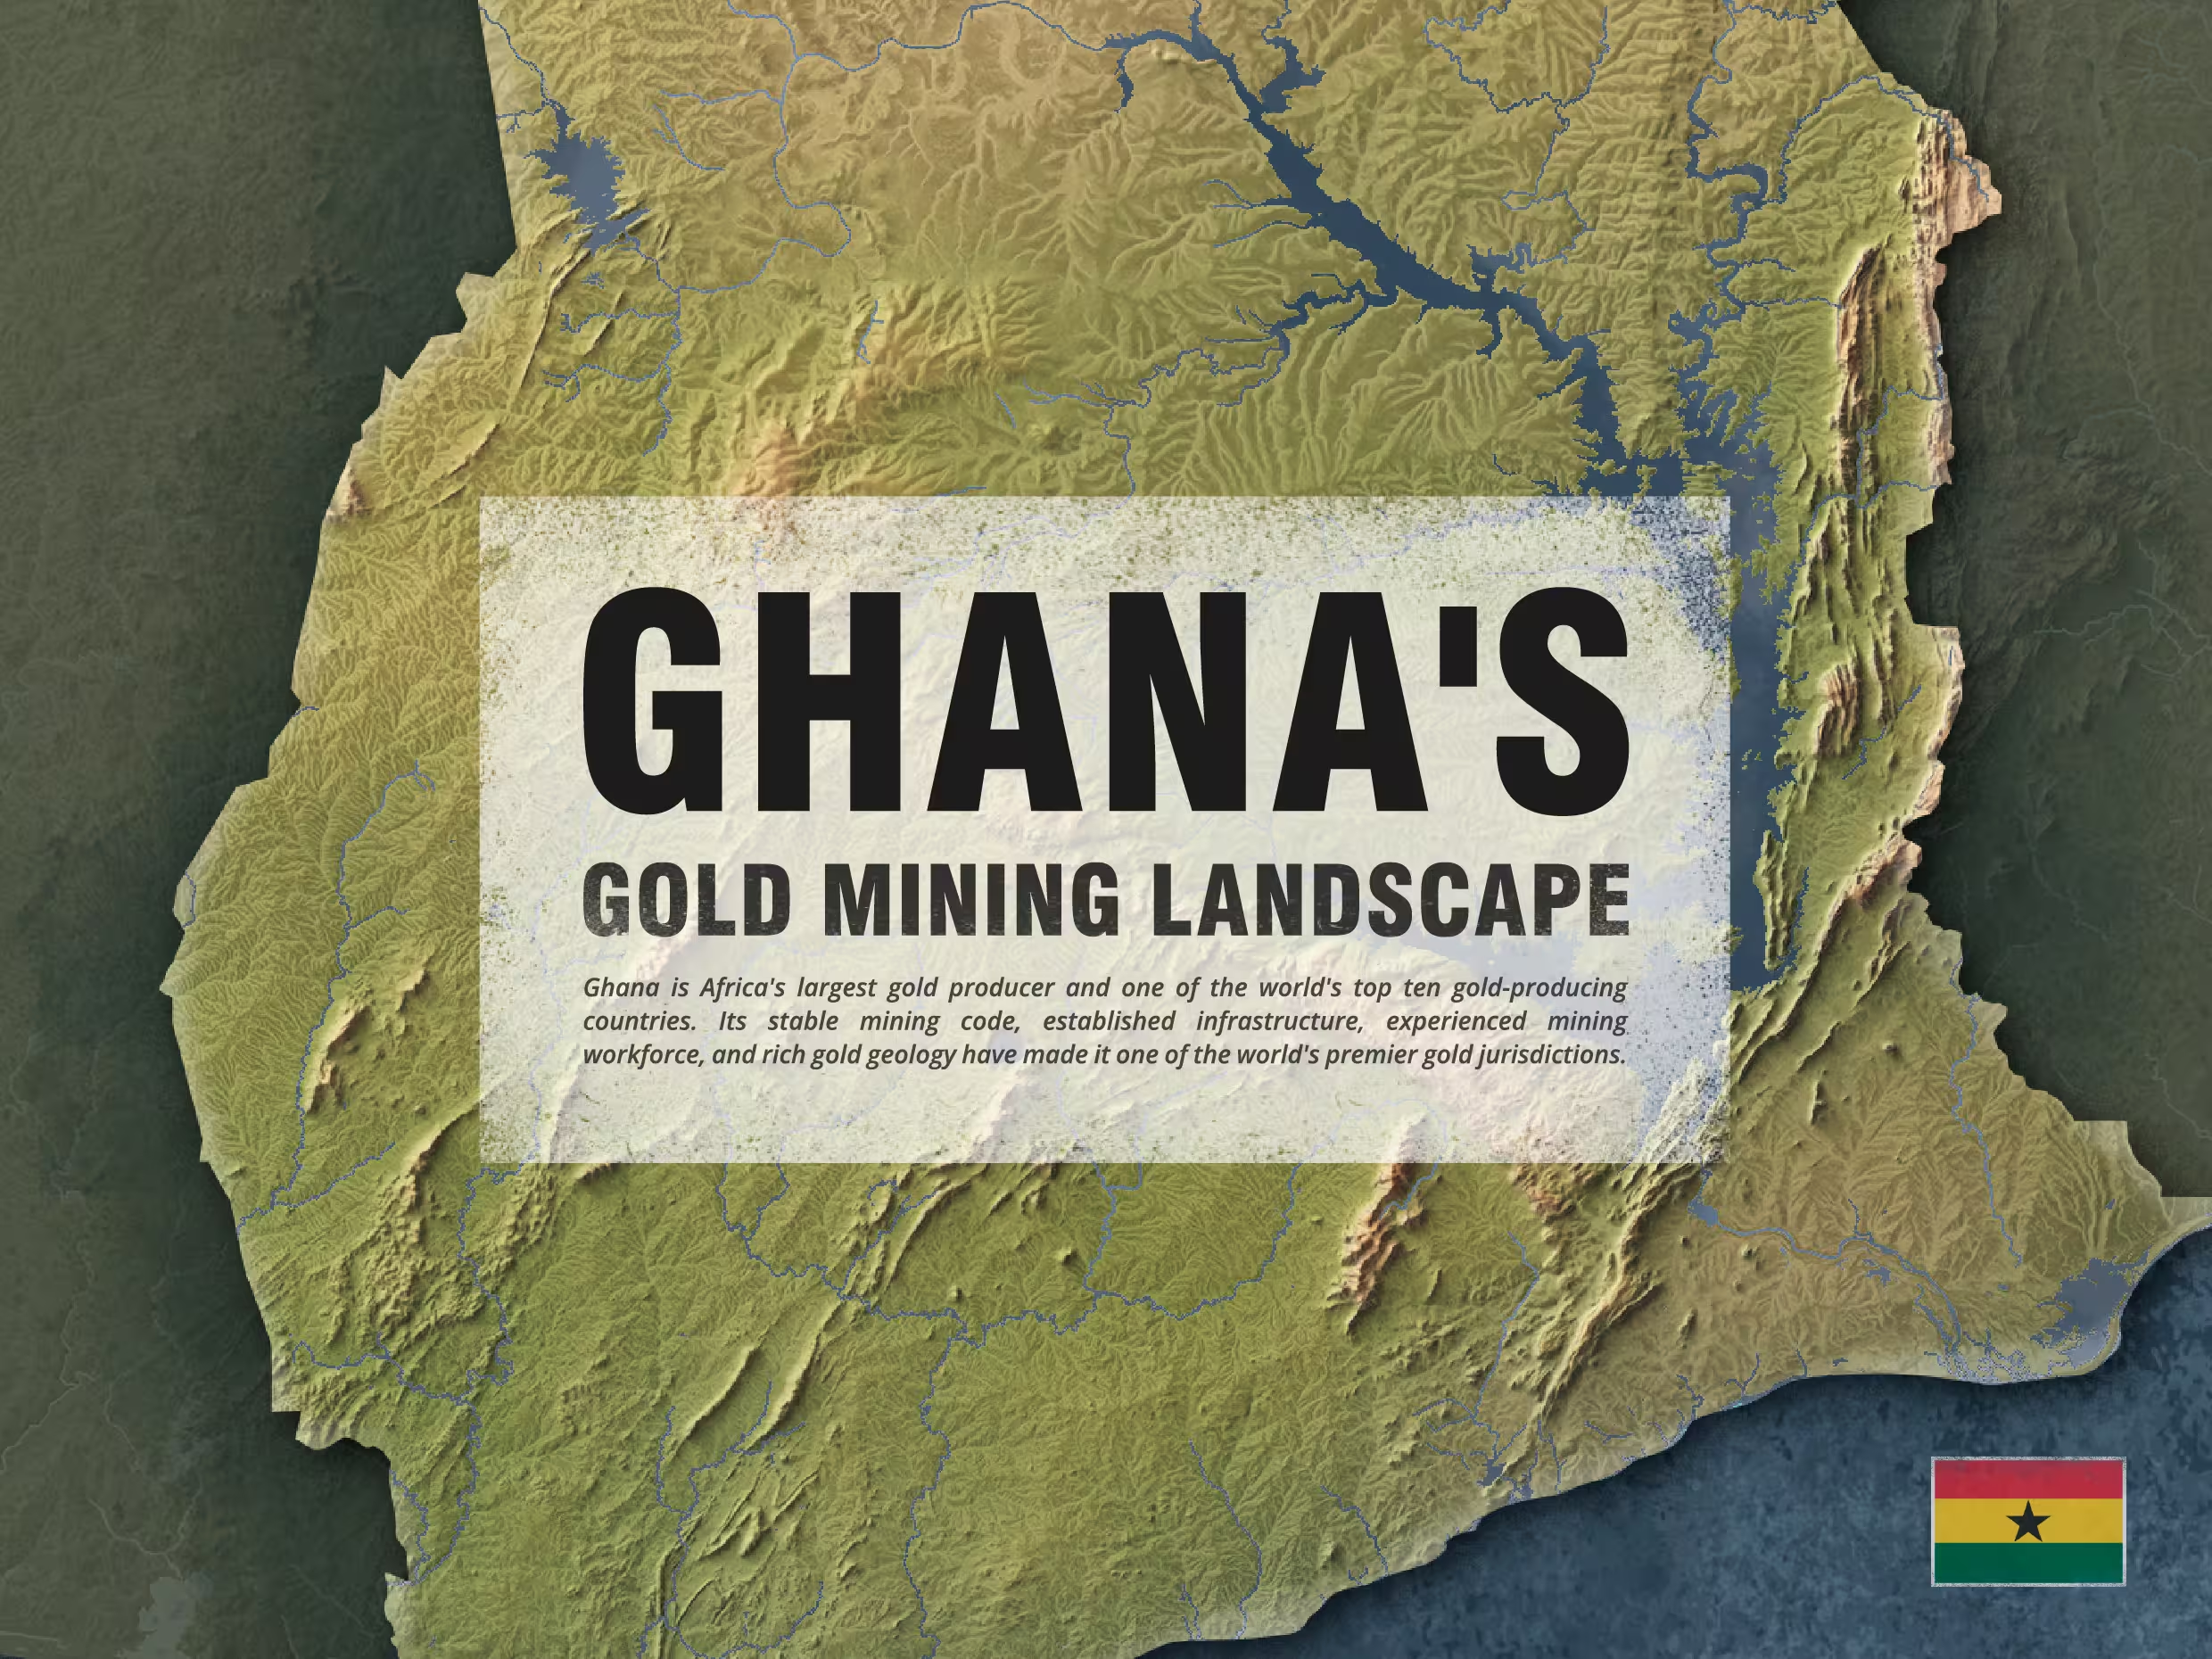
Ghana's Gold Mining Landscape: A Story Written in Ancient Rock
Ghana's Gold Mining Landscape: A Story Written in Ancient Rock
Ghana is one of the world's most significant gold-producing countries, and in 2025 it remained the largest in Africa, with national output reaching about 6 million ounces. But the numbers are only the surface. Ghana's gold reaches back more than two billion years into the rock beneath it, shaped by ancient mountain-building forces and worked by human hands for well over a century.
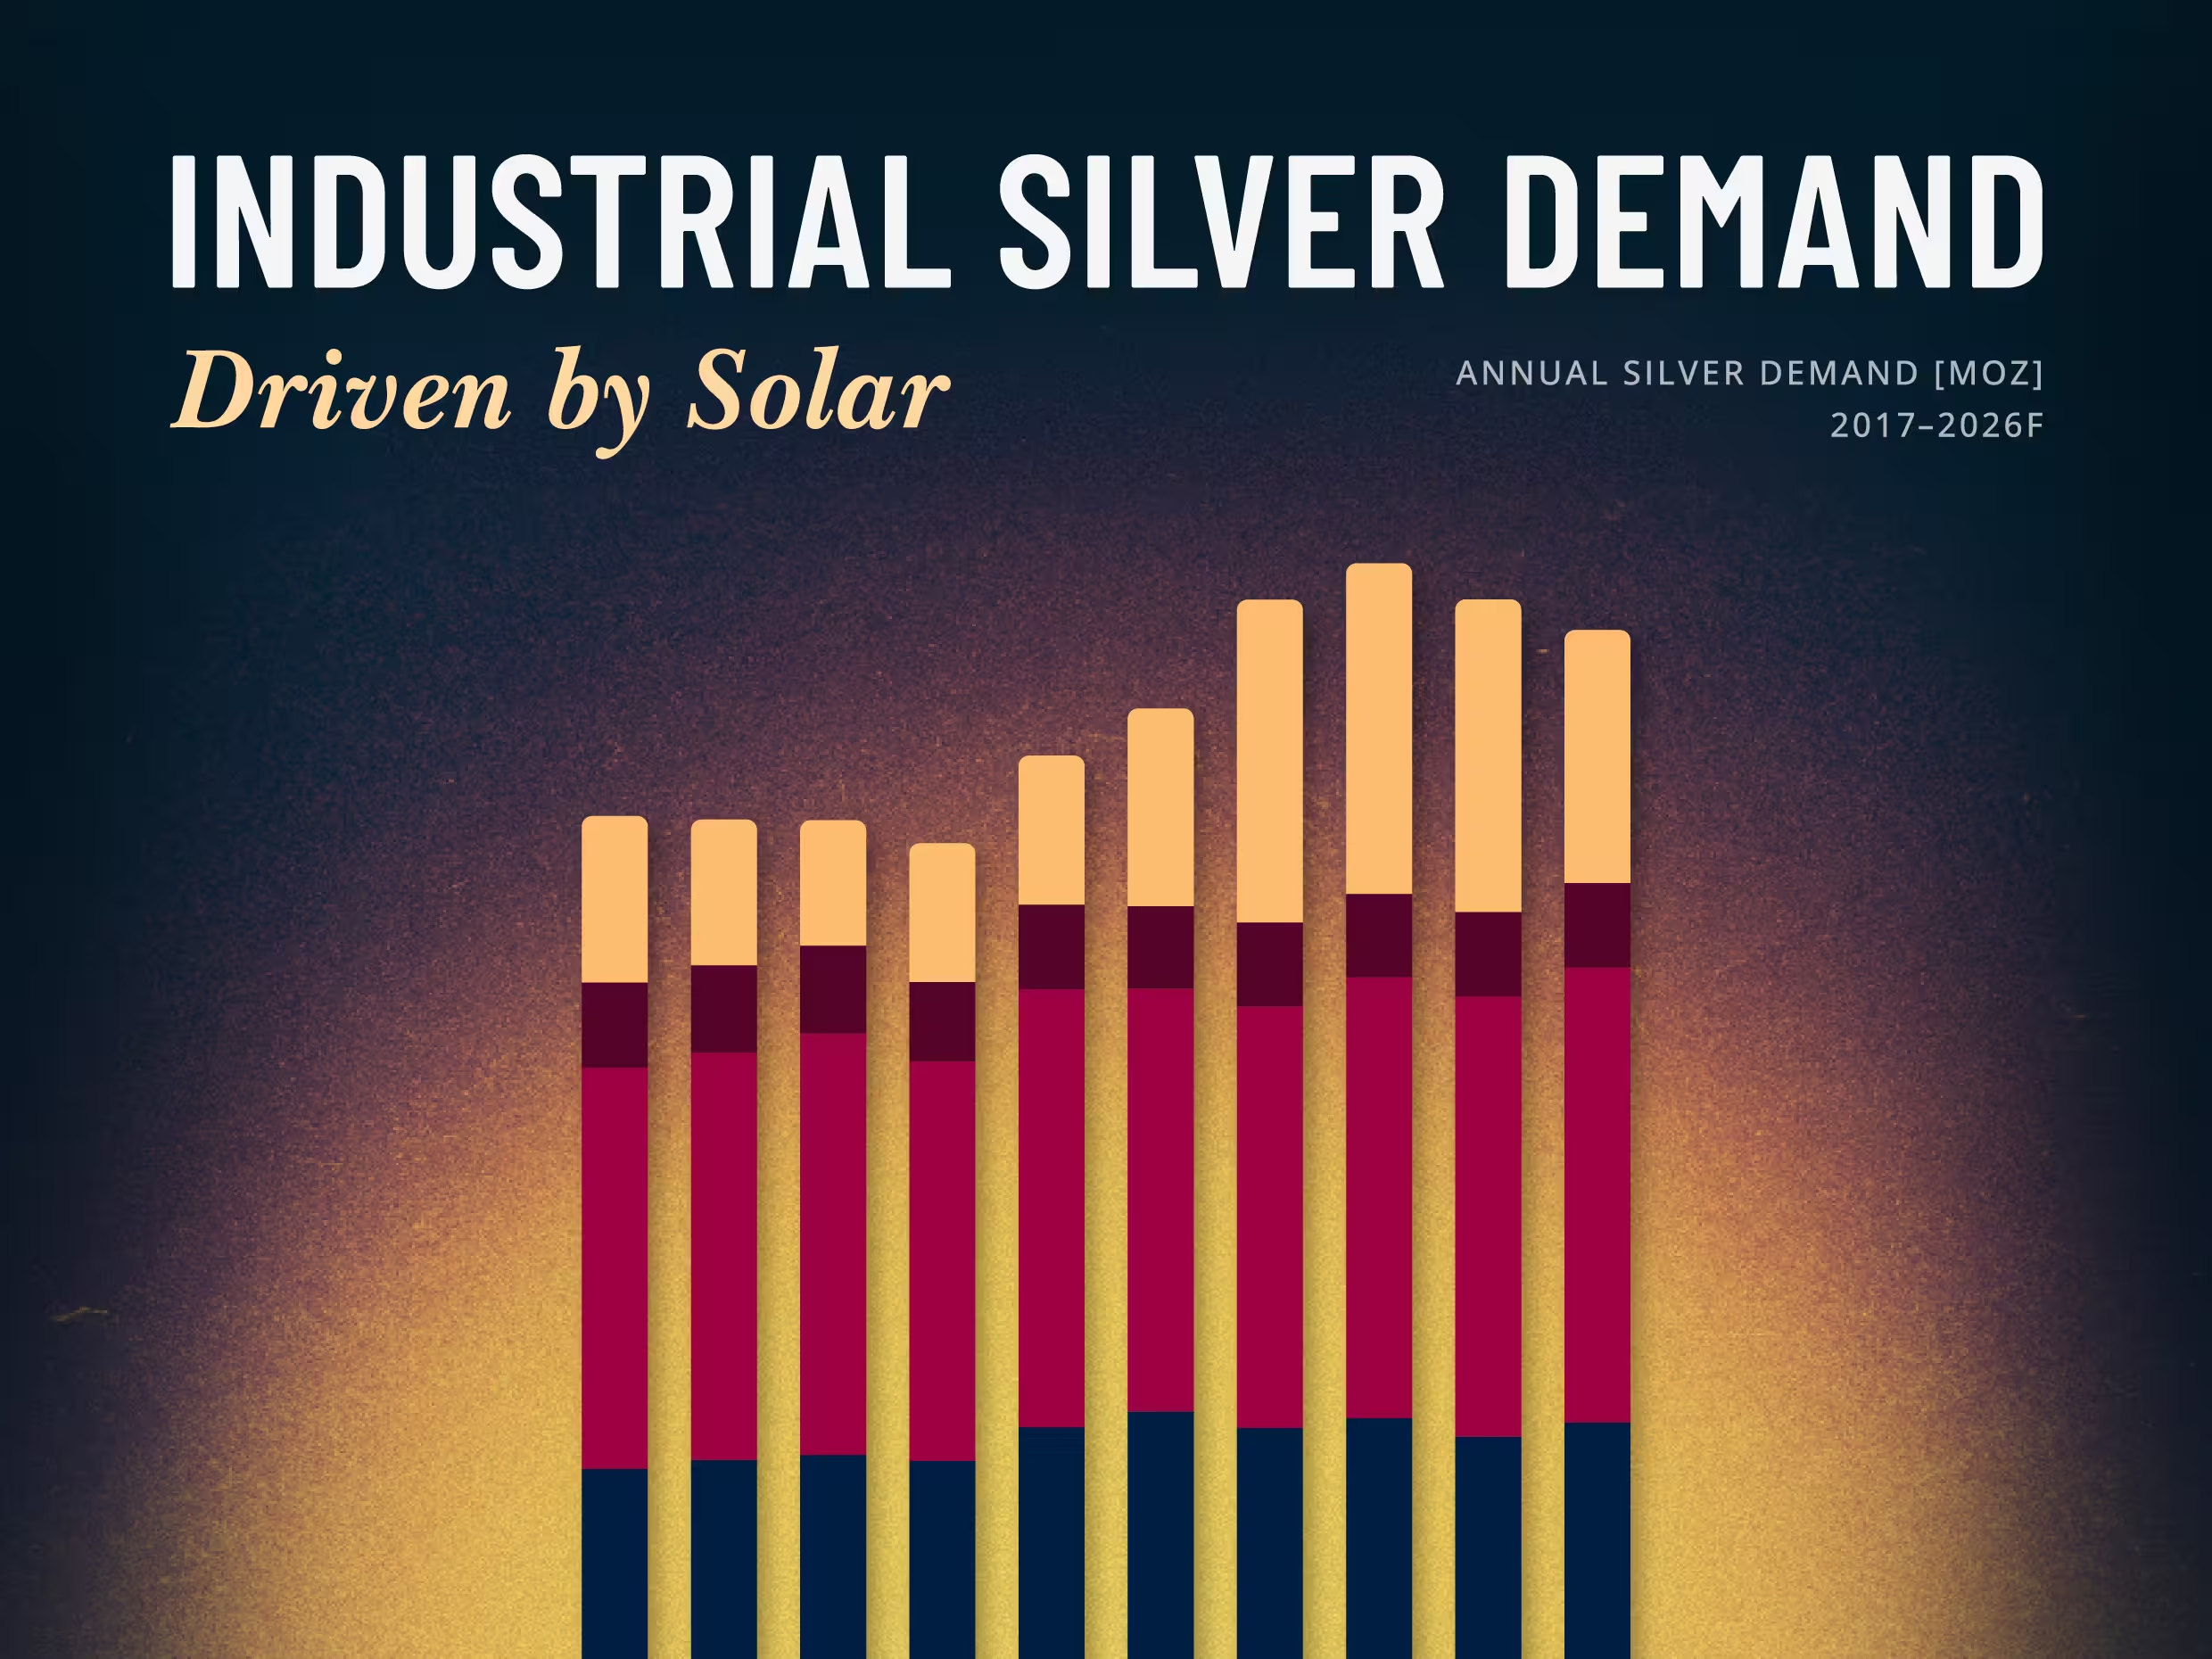
Solar Is Silver's Largest Industrial Market, and Not Easily Replaced
Solar Is Silver's Largest Industrial Market, and Not Easily Replaced
When LONGi Green Energy, the world's largest solar module maker, told investors on January 5, 2026 that it would begin mass-producing base-metal solar cells in the second quarter, it put a number on a pressure the whole industry feels. Solar is the largest single application within silver's industrial demand, and as the metal ran to a record above $121 an ounce in January, rising silver costs pushed manufacturers to accelerate efforts to reduce the metal per cell.

Silver in the Data Center: How AI's Power Crunch Is Building a New Pillar of Industrial Demand
Silver in the Data Center: How AI's Power Crunch Is Building a New Pillar of Industrial Demand
In early 2026, the artificial intelligence narrative shifted abruptly from software capabilities to physical hardware constraints. With tech giants committing hundreds of billions to new infrastructure—pushing global hyperscaler capital expenditures past $600 billion this year—the industry has collided with a new primary bottleneck: a severe power and thermal crunch.