Precious Metals
April 24, 2025
1 min
Precious Metals
%20thumbnail.avif)
Gold's allure is timeless, but where we find it has changed dramatically. Just 50 years ago, South Africa was the undisputed king, digging up nearly two-thirds of the world's gold. Watch the animation – you'll see South Africa's long reign.
But the gold map was about to be redrawn. As South Africa's deep mines became tougher and costlier, its dominance faded. China surged from a minor player to the world's top producer by 2007. Russia, Australia, Canada, the US, and nations across West Africa also rose to prominence.
The result? Gold production is no longer concentrated but spread across the globe. And thanks largely to new technologies unlocking tougher deposits, the total amount of gold mined worldwide has more than doubled compared to 50 years ago.
This animation captures that incredible 50-year shift. It’s a visual story of geology, technology, and economics reshaping the global quest for gold. What you see isn't just changing numbers, but a world transformed.
Source: ourworldindata.org and World Gold Council


Explore More
View All

Silver's Use Cases: A Visual Guide to Where the Metal Actually Goes
Silver's Use Cases: A Visual Guide to Where the Metal Actually Goes
Somewhere inside a pressurized-water reactor, an alloy that is four-fifths silver is absorbing neutrons to keep the core in check, a job most silver investors have never heard of. It is a useful reminder that the metal people picture as coins and jewelry mostly works elsewhere, across industry.

Ranked: The Countries That Produced the Most Silver in 2025
Ranked: The Countries That Produced the Most Silver in 2025
Mexico remained the world's top silver-producing country in 2025, mining 172.9 million ounces (Moz), roughly a fifth of global supply, according to the World Silver Survey 2026, produced for the Silver Institute by Metals Focus. But Mexico's lead narrowed: its output fell 5% for a third straight year, while second-place Peru climbed 7%. Global mine production rose 3% to 846.6 Moz, even as the ranking's top tier told a story of one leader sliding and its closest rival closing in.

Electric Vehicles Are Set to Become the Auto Industry's Biggest Silver Consumer by 2027
Electric Vehicles Are Set to Become the Auto Industry's Biggest Silver Consumer by 2027
Most of silver's 2026 story has been told from the supply side: a sixth straight year of structural deficit and a record price near $121 in January. Less examined is where the next leg of industrial demand actually comes from. With solar, silver's largest industrial use, now facing thrifting and substitution, the Silver Institute points to a quieter end-use picking up the slack: the automotive sector. A December 2025 study from Oxford Economics and the Silver Institute quantifies that shift, and the engine behind it is the electric vehicle.
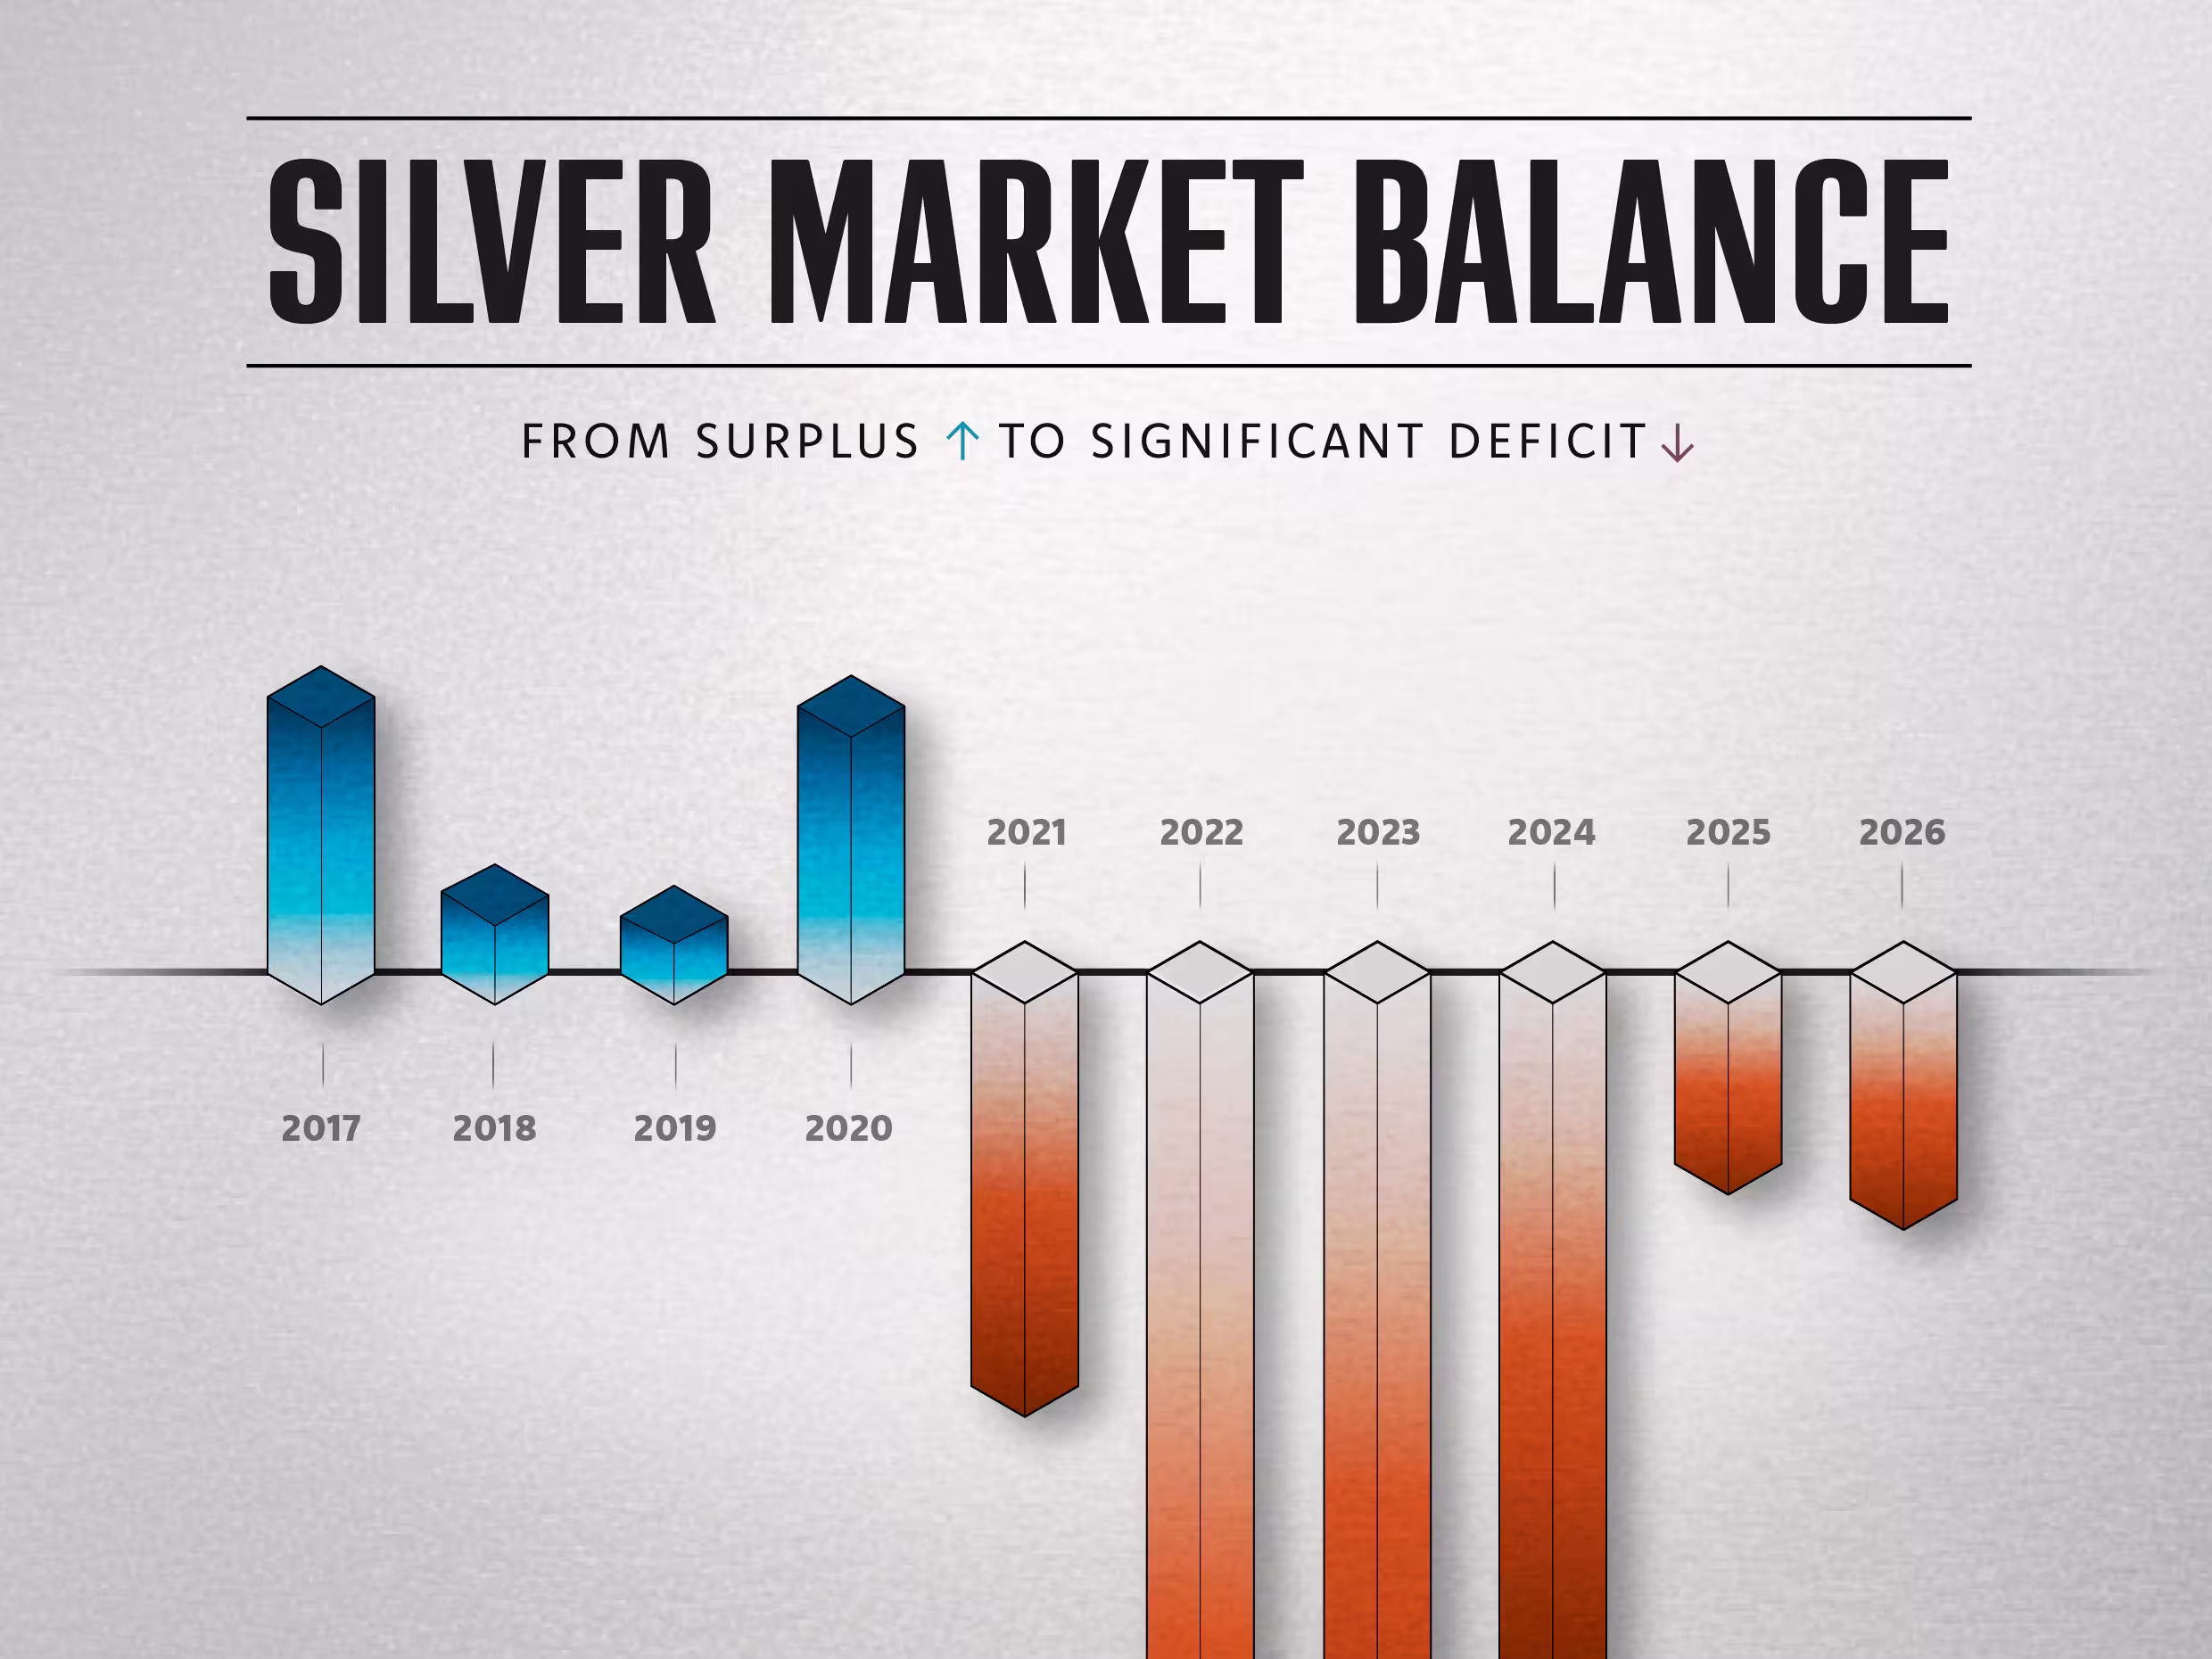
Silver Market Balance: A 2026 Update
Silver Market Balance: A 2026 Update
For the fifth year running, the world used more silver than it produced in 2025, and the World Silver Survey 2026 expects 2026 to extend that streak to six. The report, released in April by the Silver Institute and researched by the London consultancy Metals Focus, pegs the 2025 deficit at 40.3 million ounces and forecasts a wider gap of 46.3 million ounces this year. Each shortfall draws on above-ground stocks, leaving less metal readily available even as total inventories have held up.