Commodities
March 12, 2025
1 min
Commodities
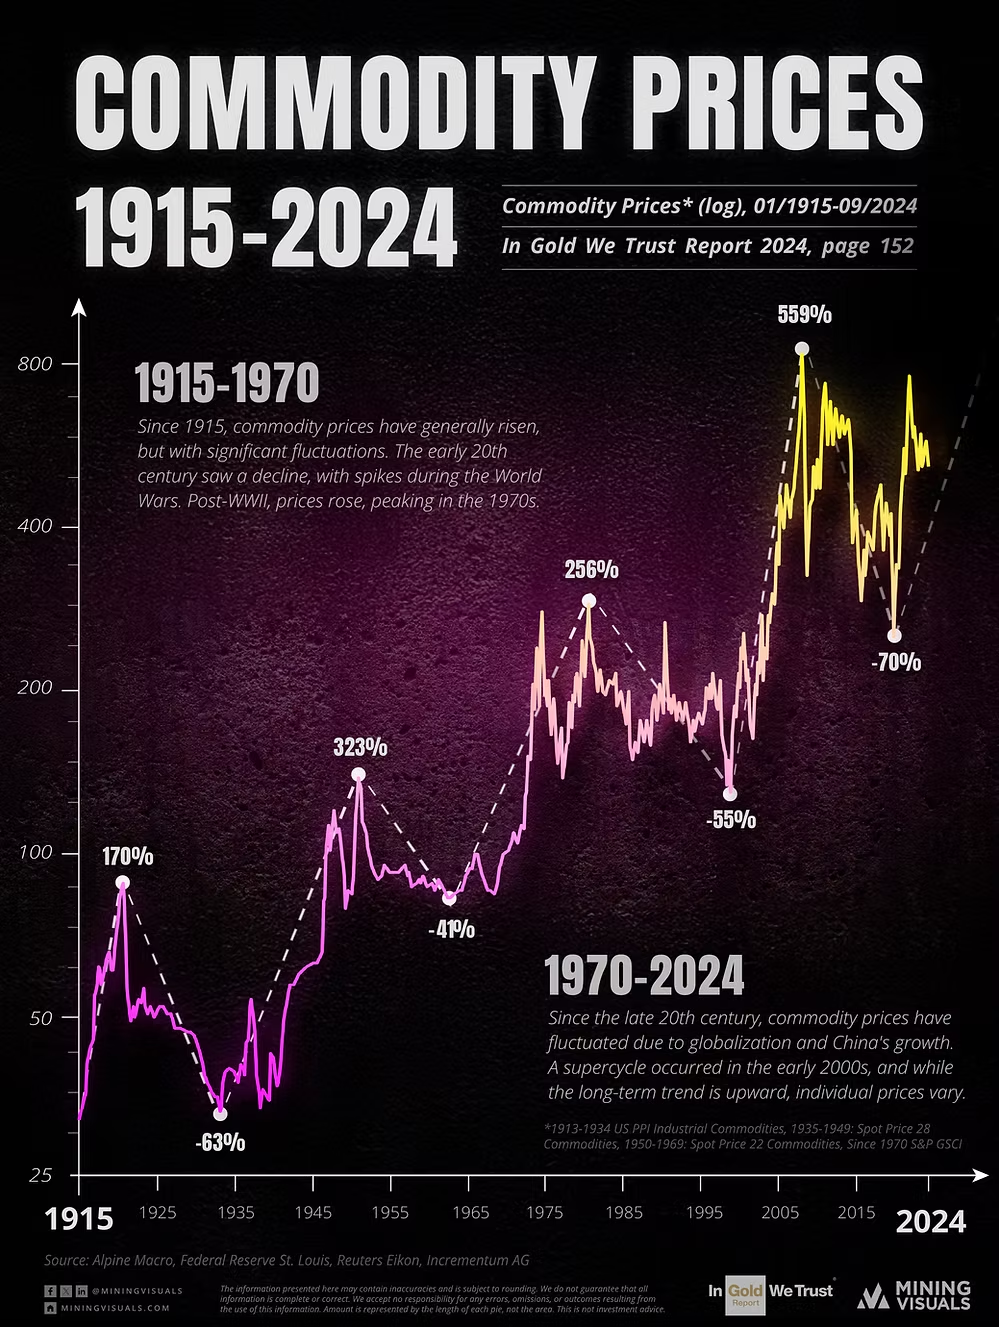

Commodity prices have been on a long-term upward trajectory, but history shows this journey is anything but steady. Over the past century, major supercycles—driven by economic booms, wars, and monetary shifts—have fueled sharp price swings.
This graphic expands on the analysis from page 152 of the In Gold We Trust (IGWT) 2024 report, which tracks commodity price movements from 1915 to 2024. The data reveals a clear long-term uptrend, marked by dramatic peaks and corrections. The most recent peak in 2008 was followed by a steep 70% decline, but prices have rebounded significantly since then. If history is any guide, the next peak could surpass previous all-time highs.
What Drives Commodity Supercycles?
🔹 Boom-and-Bust Cycles: From the roaring 1920s surge and Great Depression collapse to the post-WWII reconstruction boom, commodities have soared and crashed alongside global events.
🔹 Inflation & Monetary Policy: Loose monetary policies and inflationary eras—such as the 1970s stagflation, post-2008 stimulus, and 2020s supply chain disruptions—have historically fueled price surges.
🔹 Energy & Metals as Key Drivers: Oil shocks in the 1970s, China’s industrial boom in the 2000s, and geopolitical tensions in the 2020s have all played a major role in commodity price swings.
🔹 Safe Haven in Uncertainty: Commodities, particularly gold, have consistently outperformed during periods of economic instability, inflation, and currency devaluation.
What’s Next?
With inflation concerns, geopolitical risks, and tightening supply chains, are we witnessing the early stages of another commodity supercycle?
As the IGWT report states:
"In previous supercycles, commodities have significantly surpassed their respective all-time highs. We believe that in the current cycle, there is still considerable upside potential for commodities, and after the consolidation phase, price dynamics could resume."
Source: In Gold We Trust report 2024 page 152





Explore More
View All

Behind Tin's 2026 Record High
Behind Tin's 2026 Record High
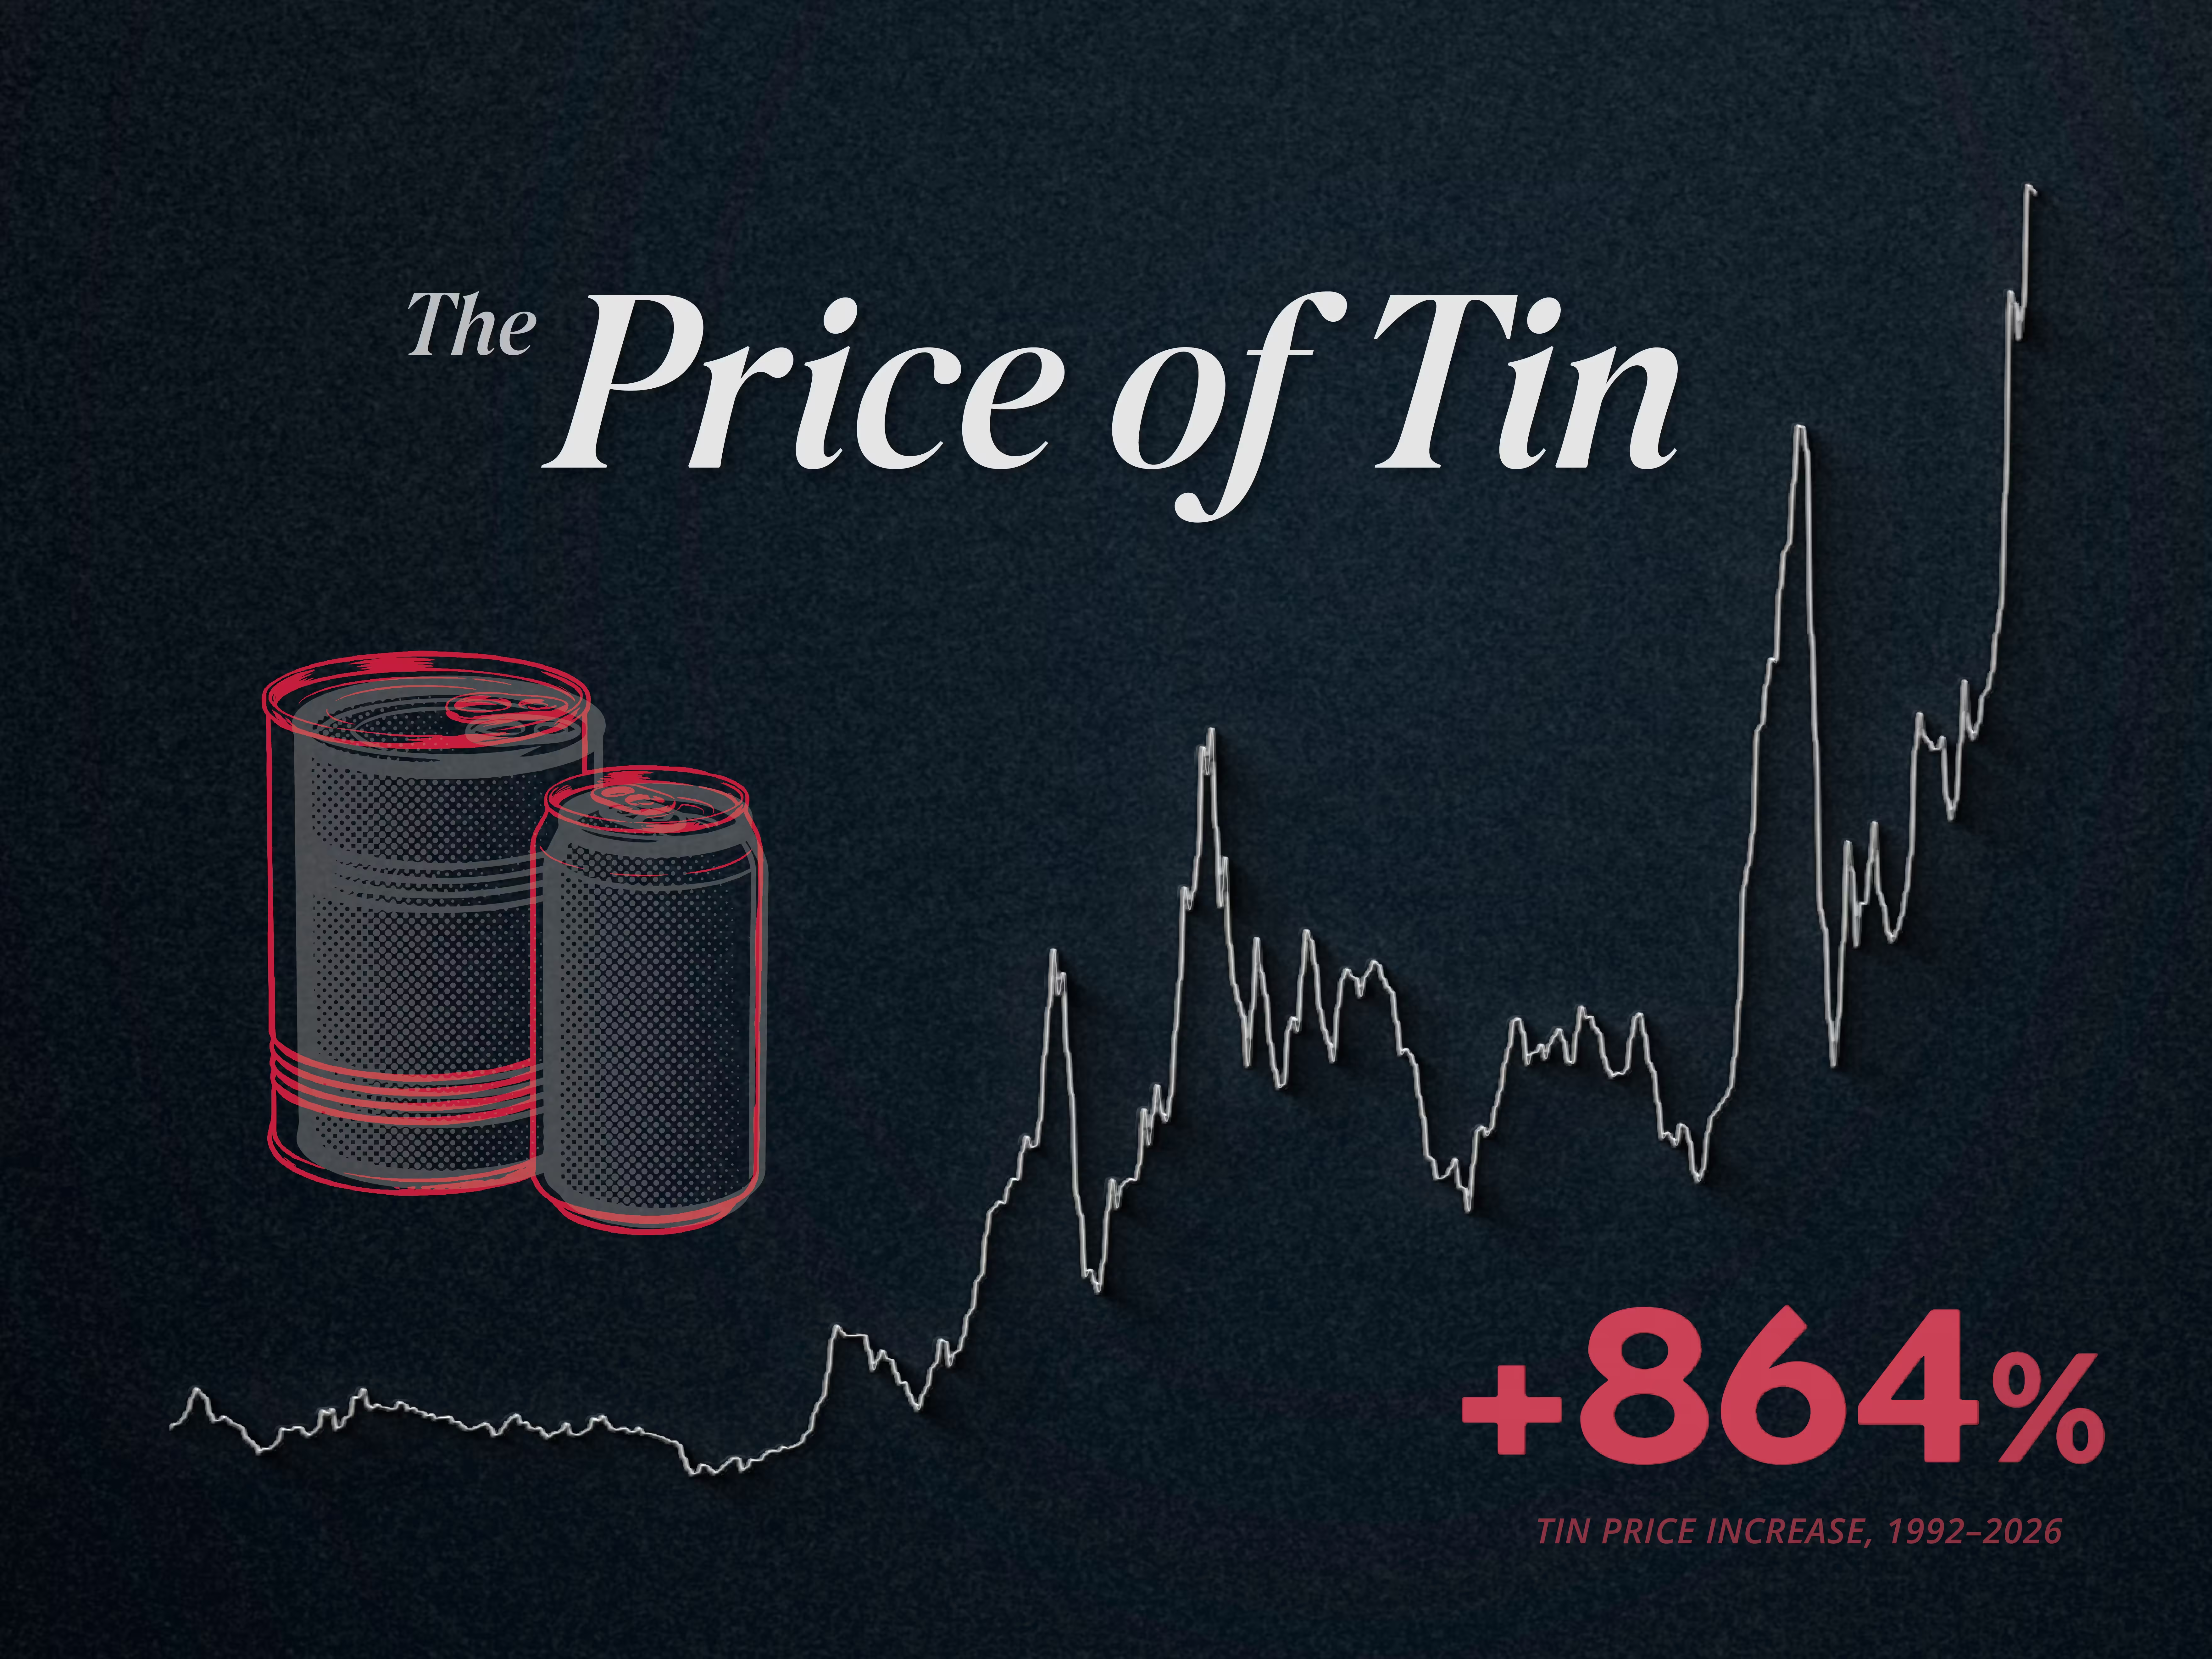
In January 2026, the London Metal Exchange three-month tin contract closed at US$53,462 a tonne, a nominal all-time high that surpassed the March 2022 peak, and it has traded near those levels since. The puzzle is that there is no shortage of tin today: exchange inventories actually rose as the price climbed, rather than being drawn down. Two very different things are holding the price up. The first is short-term: a wave of investor buying, which the industry says drove the January jump. The second is long-term: on current forecasts, the world will not mine enough tin to meet demand later this decade, a gap already projected before the rally began and expected to persist after it fades. The lasting story is that forecast shortfall, not the spike.
The Age of Giants: How Mining Shovels Grew, Peaked, and Deliberately Shrank
The Age of Giants: How Mining Shovels Grew, Peaked, and Deliberately Shrank
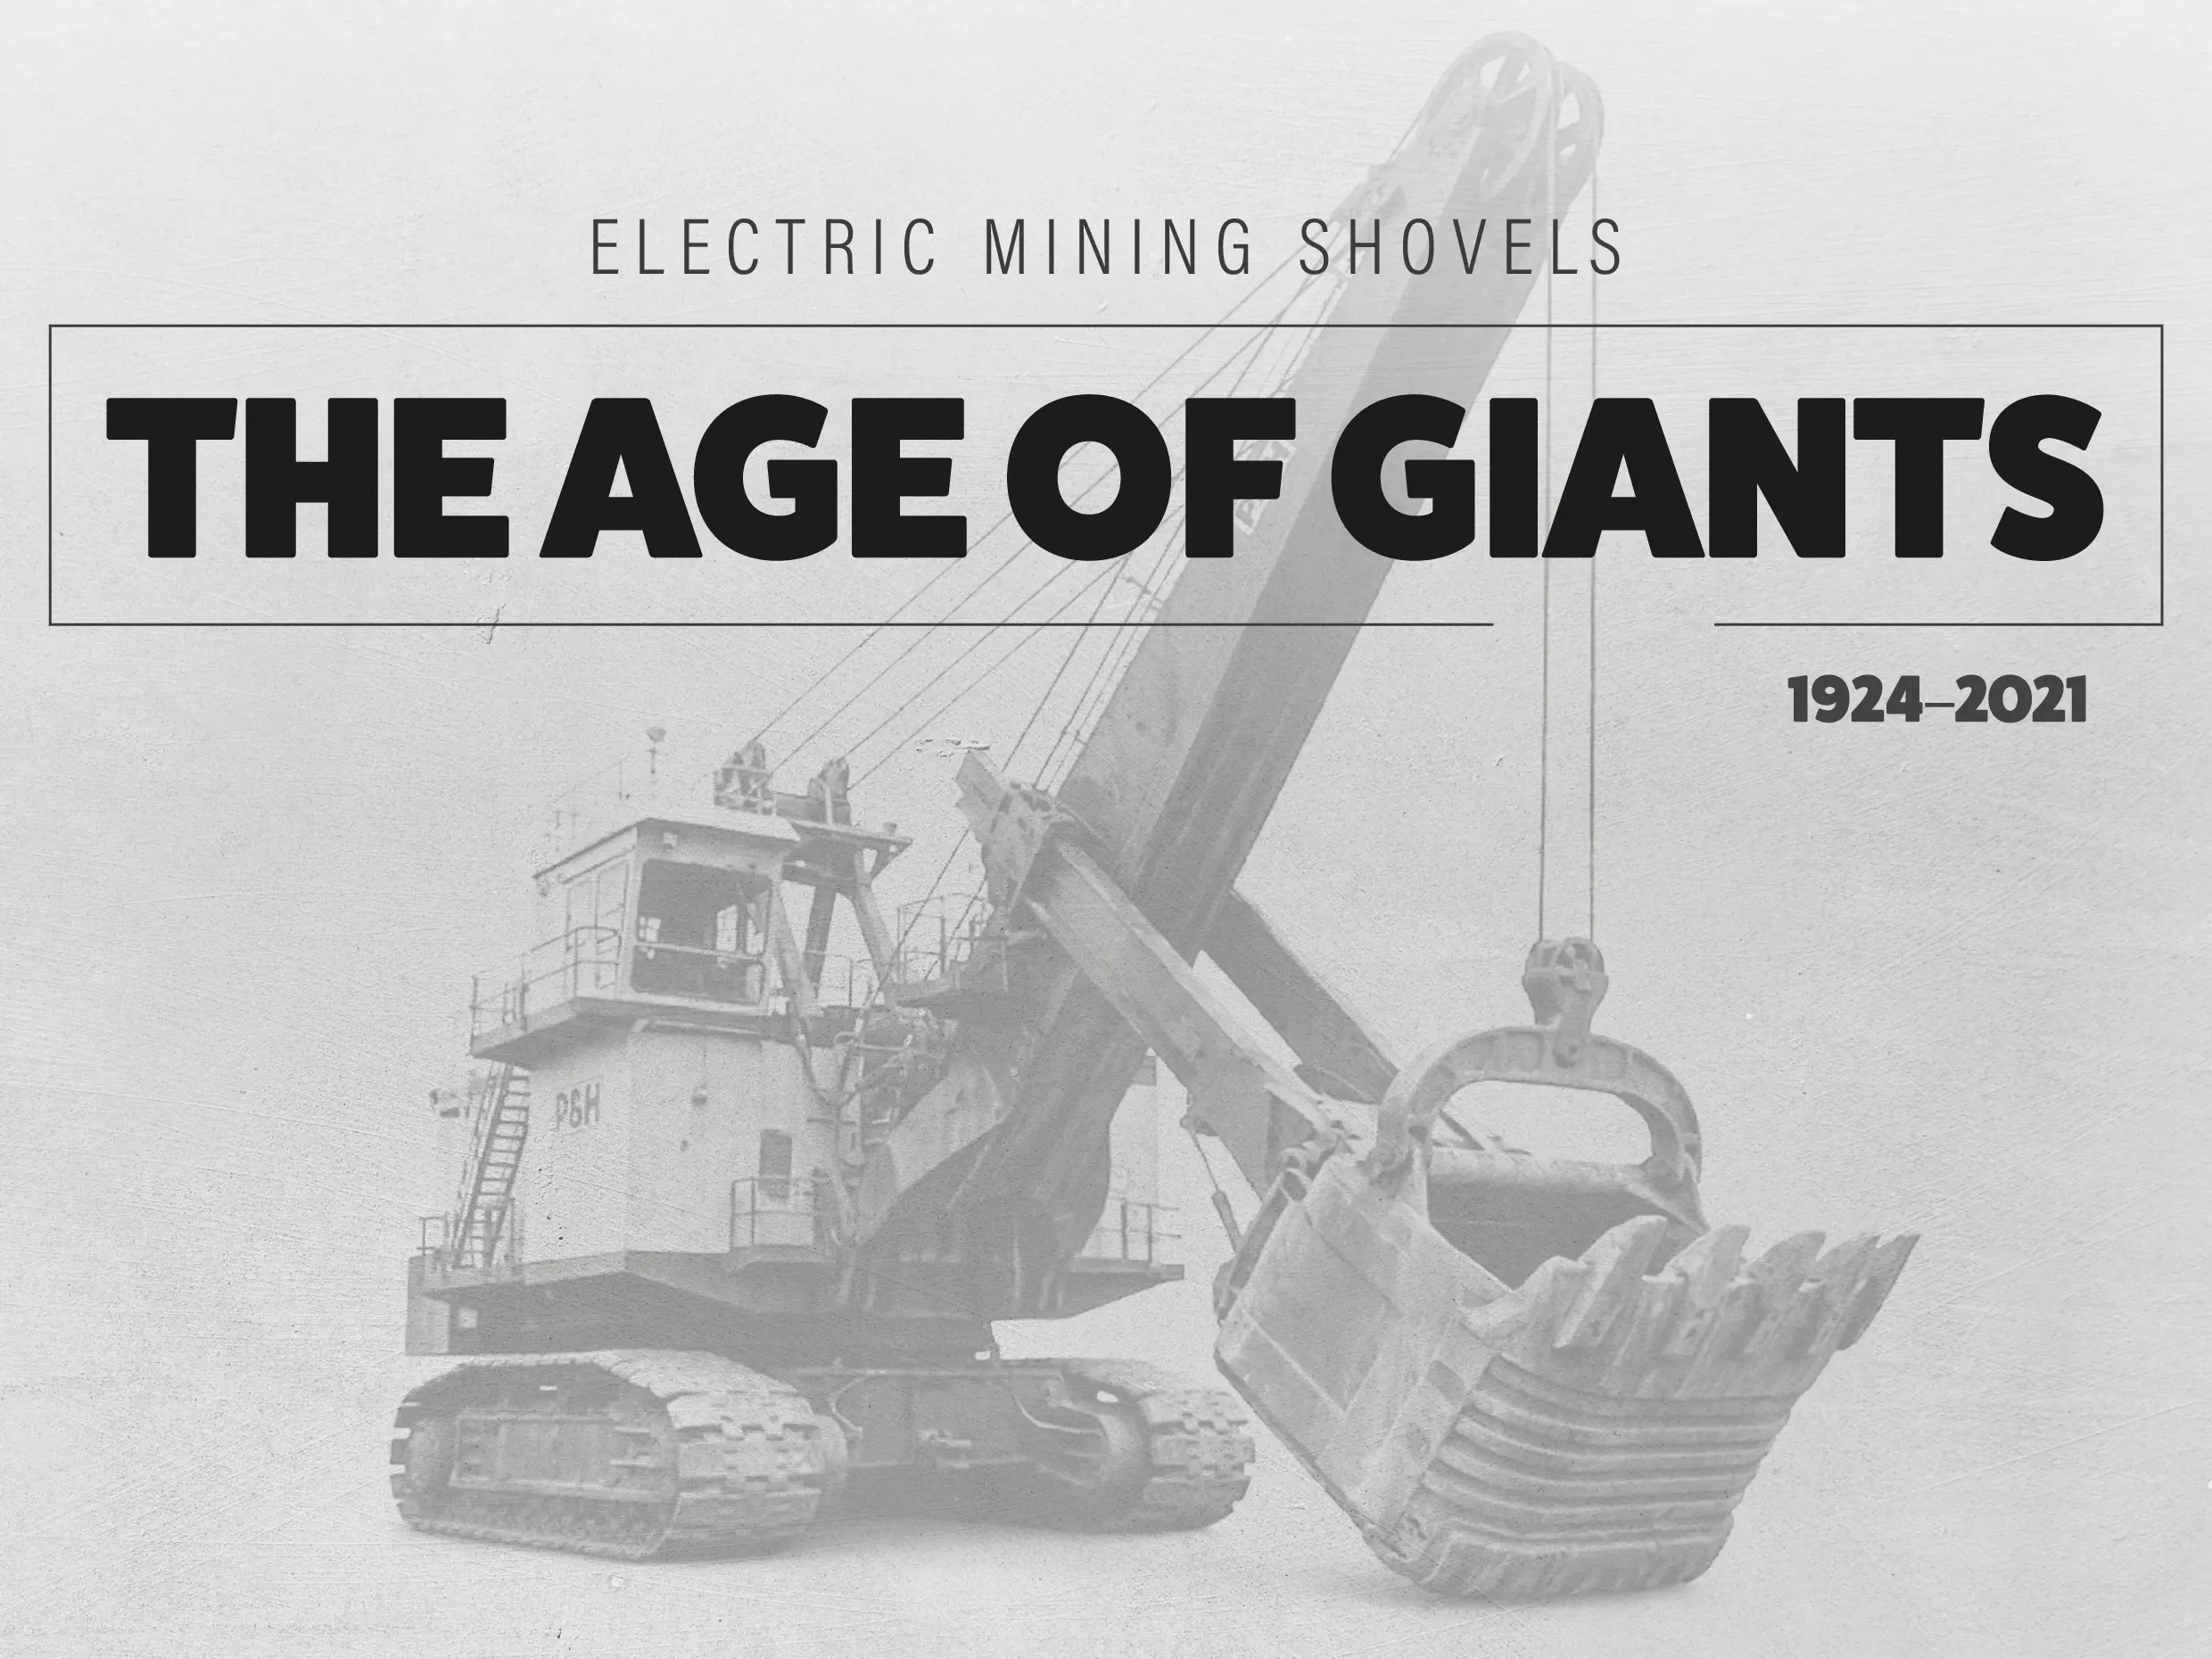
For four decades, the American coalfields hosted an engineering arms race measured in cubic metres of bucket. It ended not with a bigger machine, but with a deliberate retreat. The single largest mobile land machine ever built, the Marion 6360 "Captain," was commissioned in 1965 and destroyed by fire in 1991. No shovel has approached its scale since, and the machines that replaced it were smaller by design.
Where Indium Goes: The Metal Behind Screens, Chips, and Solar
Where Indium Goes: The Metal Behind Screens, Chips, and Solar
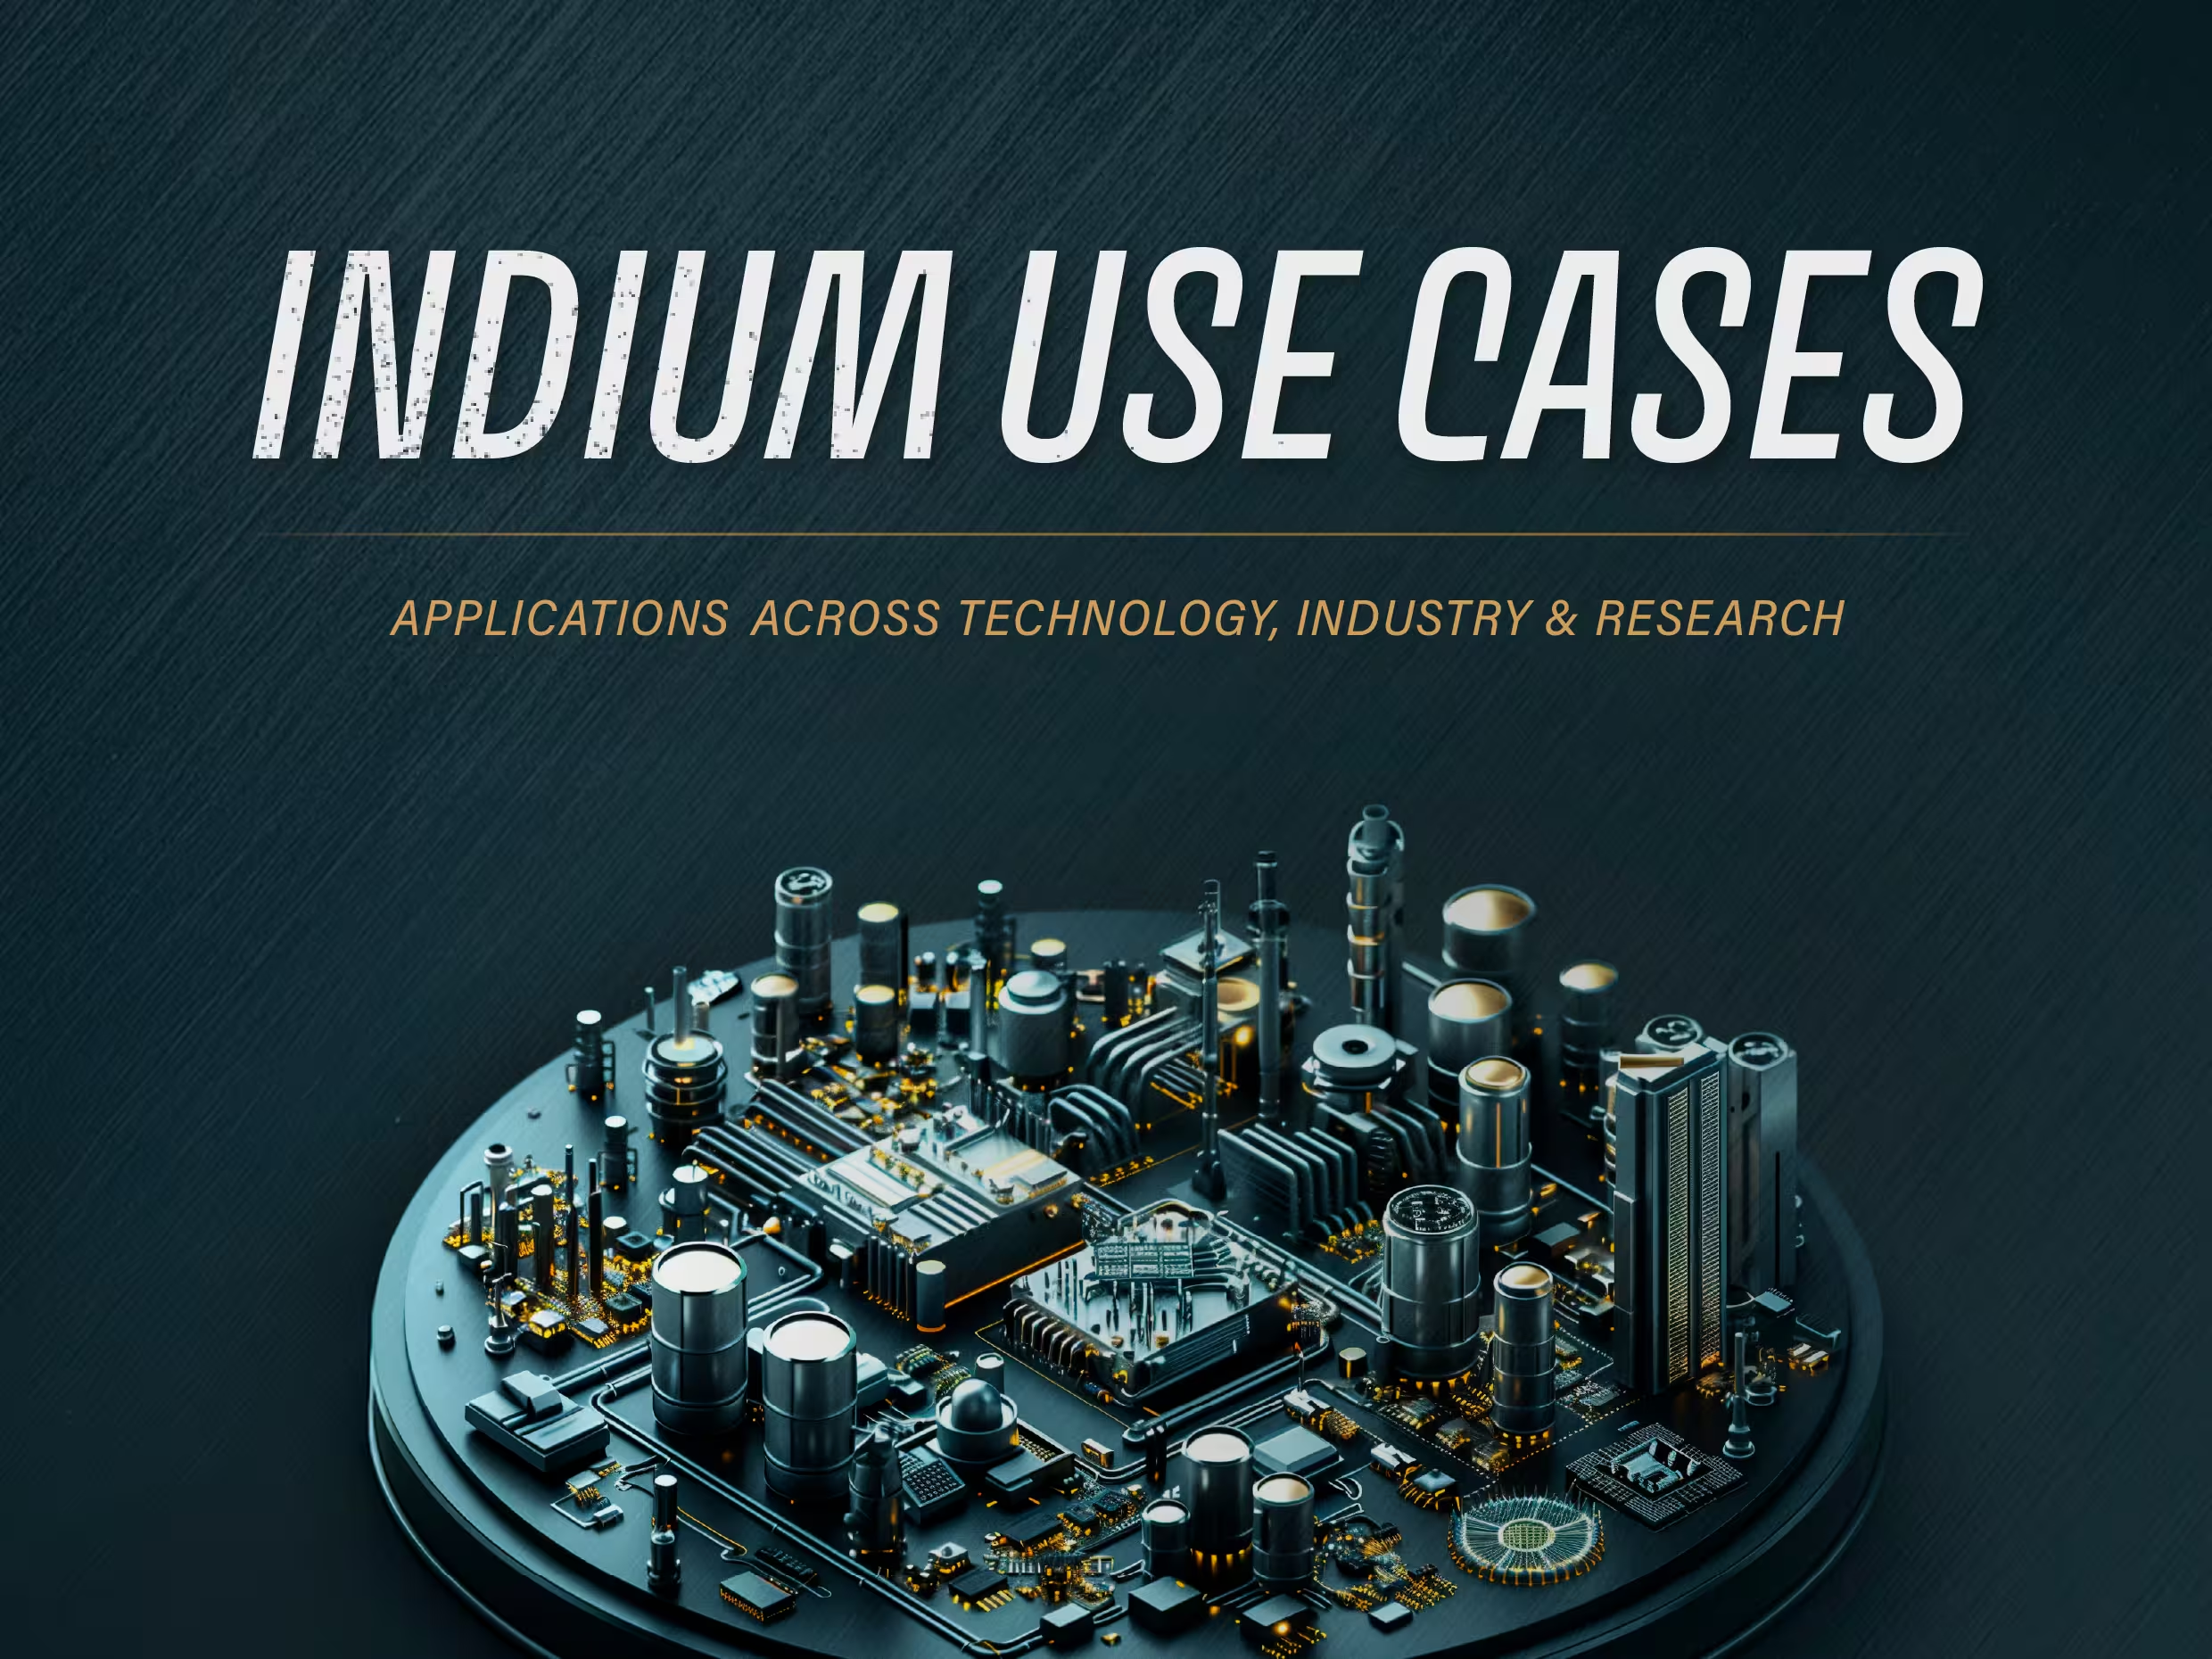
Indium is one of the metals you never see but use constantly. As indium tin oxide, it forms the transparent conductive coating on nearly every LCD and touchscreen, and that single application still accounts for most global consumption, according to the USGS. But the metal's role is broadening. Its compounds now sit inside the high-speed optical chips that route data through AI data centers, a shift that has turned a quiet, display-driven material into one buyers watch closely, especially as China refines about 70% of it and has begun tightening the flow.

Rare Earths and the F-35: The Defense Supply-Chain Bottleneck Behind America's Most Advanced Fighter Jet
Rare Earths and the F-35: The Defense Supply-Chain Bottleneck Behind America's Most Advanced Fighter Jet
In September 2022, the Pentagon quietly stopped taking delivery of new F-35 fighter jets. The reason was not a design flaw or a manufacturing defect. A single small magnet inside the plane's engine had been made using an alloy from China, which is banned under U.S. defense procurement law.