The global copper market presents a striking contradiction: we possess enough copper to sustain humanity for centuries, yet the industry warns of looming deficits. The answer lies in the massive gap between geological abundance and economic availability.
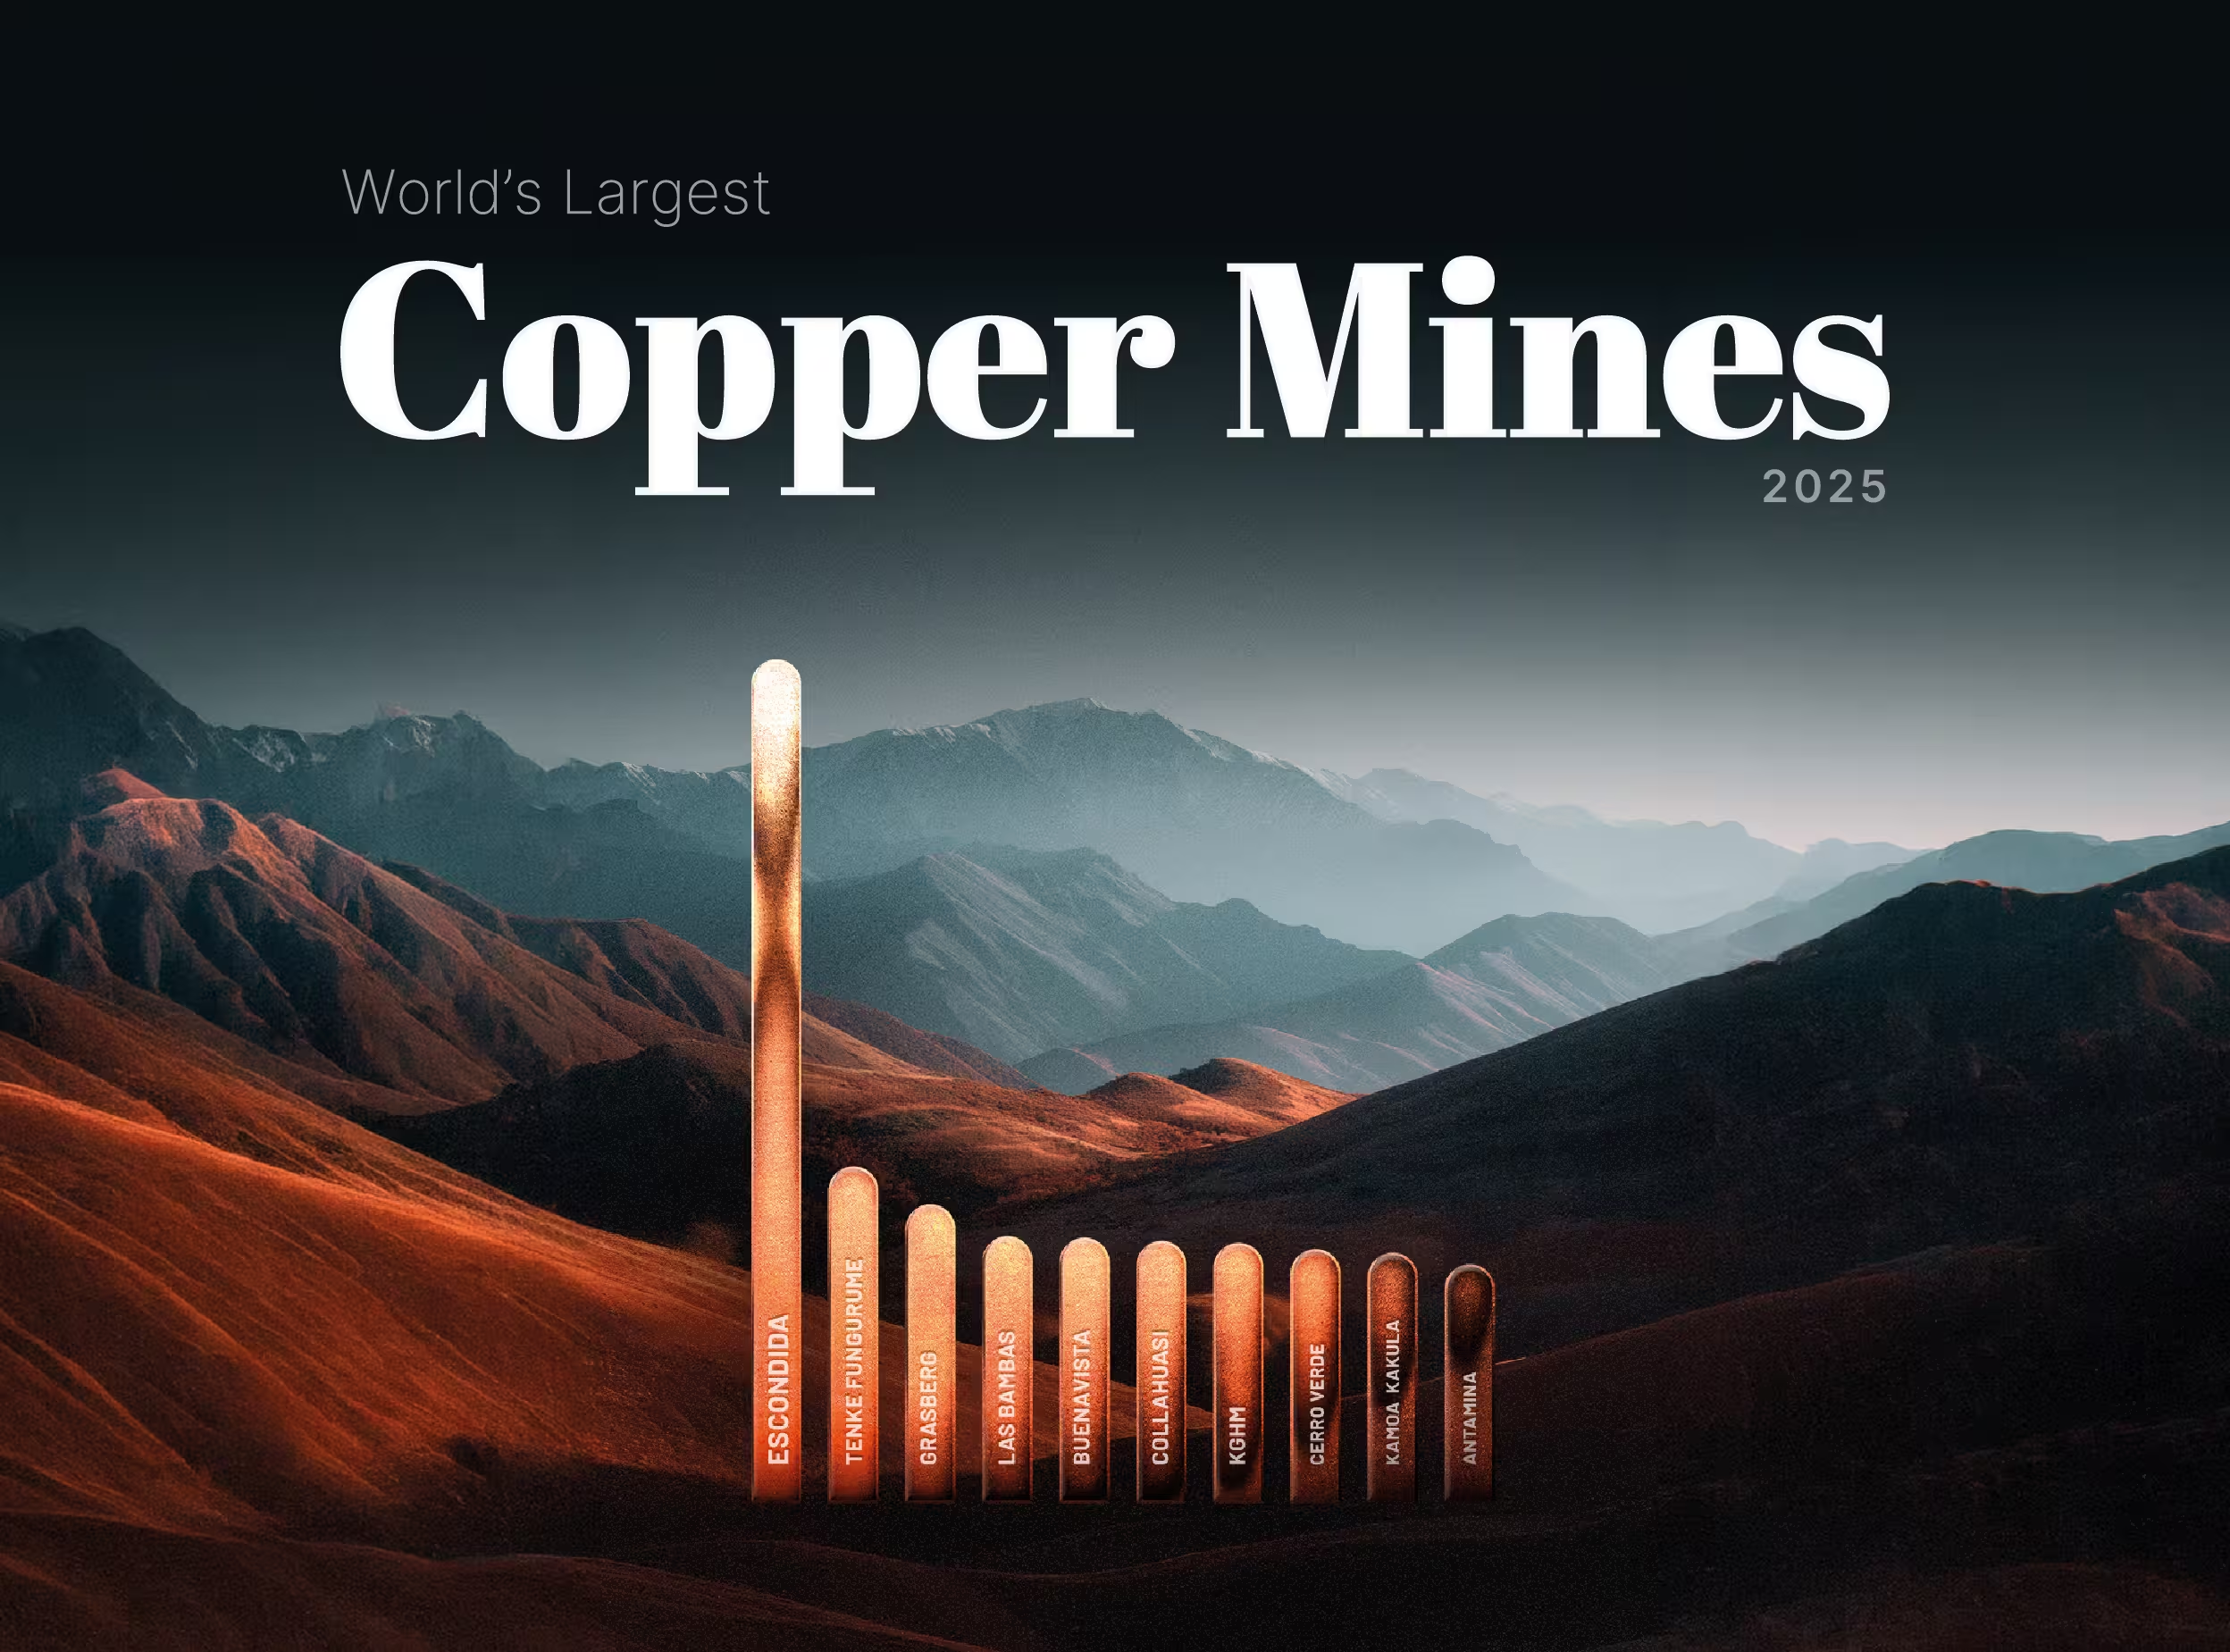
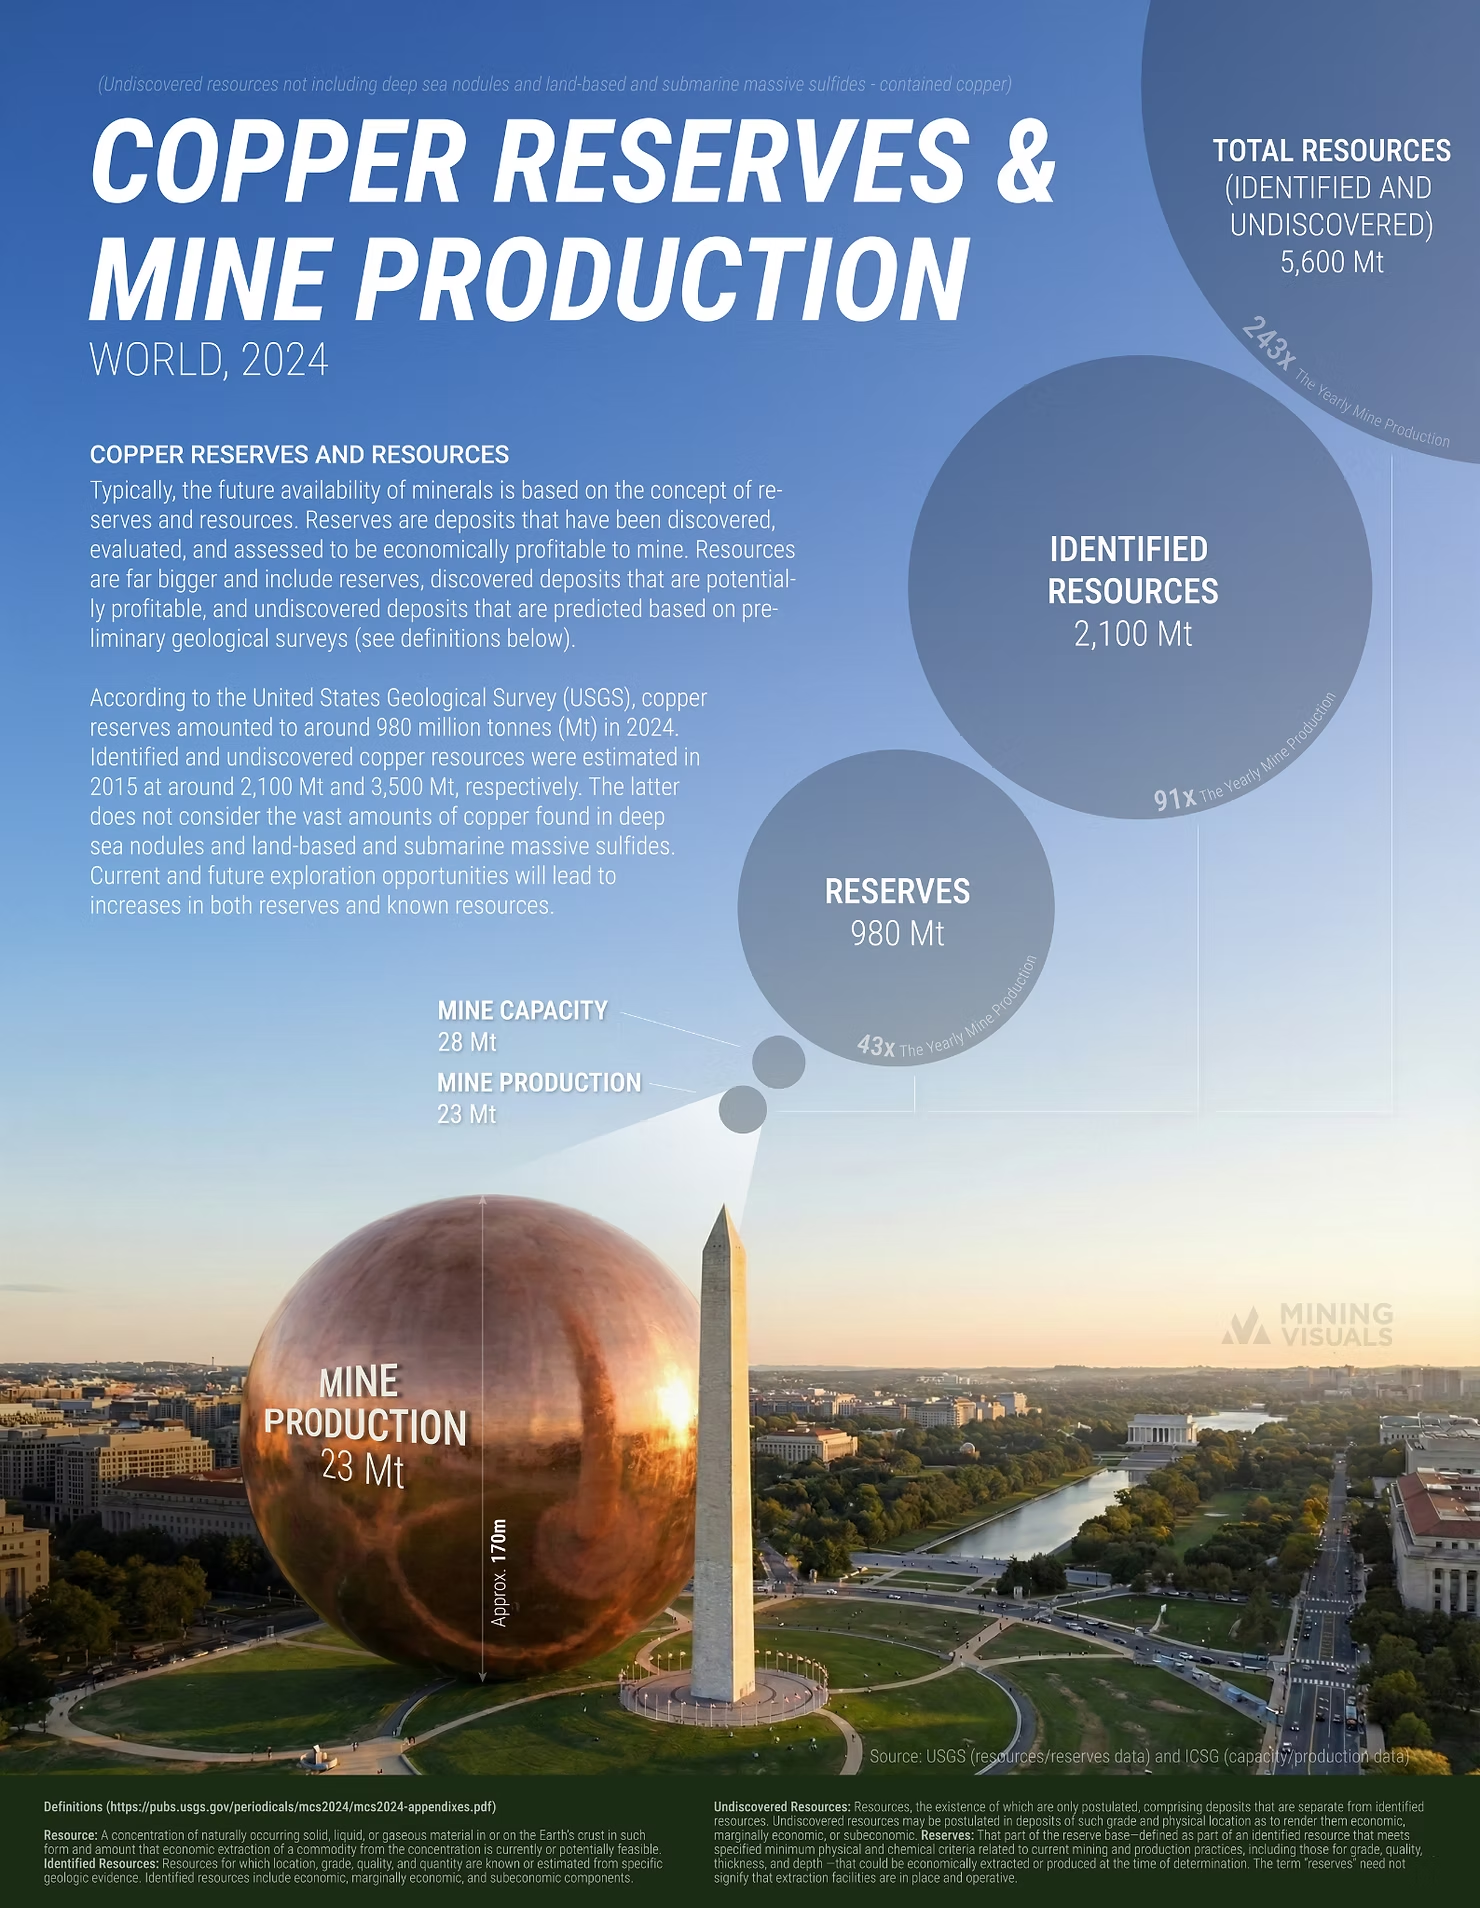
To understand this, one must distinguish between "Resources" (what exists in the Earth) and "Reserves" (deposits profitable to mine today). According to the International Copper Study Group (ICSG), total identified and undiscovered resources amount to 5,600 million tonnes (Mt) . With annual mine production at just 23 Mt, the world holds roughly 243 times more copper in the ground than we extract each year. Even focusing strictly on identified resources, there are 2,100 Mt available.
Table 1: The Geological vs. Economic Reality
The Dynamic Nature of Supply
A common fallacy is dividing current reserves by annual production to conclude we have only ~40 years of supply left. Historical data refutes this; since 1960, the world has consistently maintained about 40 years of reserves despite rising demand.
Reserves are dynamic. As exploration and technology advance, resources are continually upgraded into "bankable" reserves. Between 2000 and 2024, the world mined 441 Mt of copper, yet global reserves actually grew by 547 Mt . We are finding viable copper faster than we are extracting it.
Why Access is the Real Bottleneck
The "supply crunch" stems from operational hurdles, not geological scarcity. Converting resources into active production is increasingly difficult due to declining ore grades in mature regions like the U.S. and Chile, which require moving more rock for the same metal output. Environmental factors compound these challenges, as many large deposits are in water-scarce regions where securing water rights is critical. Additionally, complex permitting and political risks have significantly lengthened the timeline for bringing new supply online.
The Demand Super-Cycle
These supply constraints collide with a demand "super-cycle" driven by the clean energy transition. Technologies essential for decarbonization are far more material-intensive than fossil-fuel counterparts. Infrastructure for renewables and grid expansion relies heavily on copper for conductivity, while the shift to electric vehicles (EVs) is a major driver of new consumption.
Table 2: Copper Intensity in Vehicle Electrification
[Source: International Copper Association via Copper.org]
The "Urban Mine" Solution
To bridge the gap, the market turns to the circular economy. Copper can be recycled infinitely without performance loss. This "Urban Mine" of scrap metal already meets about one-third of global usage. Beyond supply, recycling offers immense efficiency, requiring up to 85% less energy than mining new ore.
The Bottom Line
We are not running out of copper. The challenge is not geological scarcity, but the economic and logistical feat of unlocking these resources, through timely mine development and enhanced recycling, to meet the soaring demands of an electrified future.