Gold continues to dominate the macroeconomic spotlight. As gold prices repeatedly shattered all-time record highs in 2024, investor attention intensely pivoted toward the resilience of global supply chains. While total global volume remains robust, the geographical sources of this ancient wealth have undergone a dramatic, permanent transformation. A half-century ago, a single nation produced a staggering majority of the world's gold. Today, production is highly decentralized, led by a new undisputed heavyweight. By examining the exact historical output data sourced from Our World in Data, we can track the precise mathematical timeline of how geological constraints and aggressive state funding reshaped the global gold market between 1975 and 2024.
The Collapse of South Africa's Gold Dominance
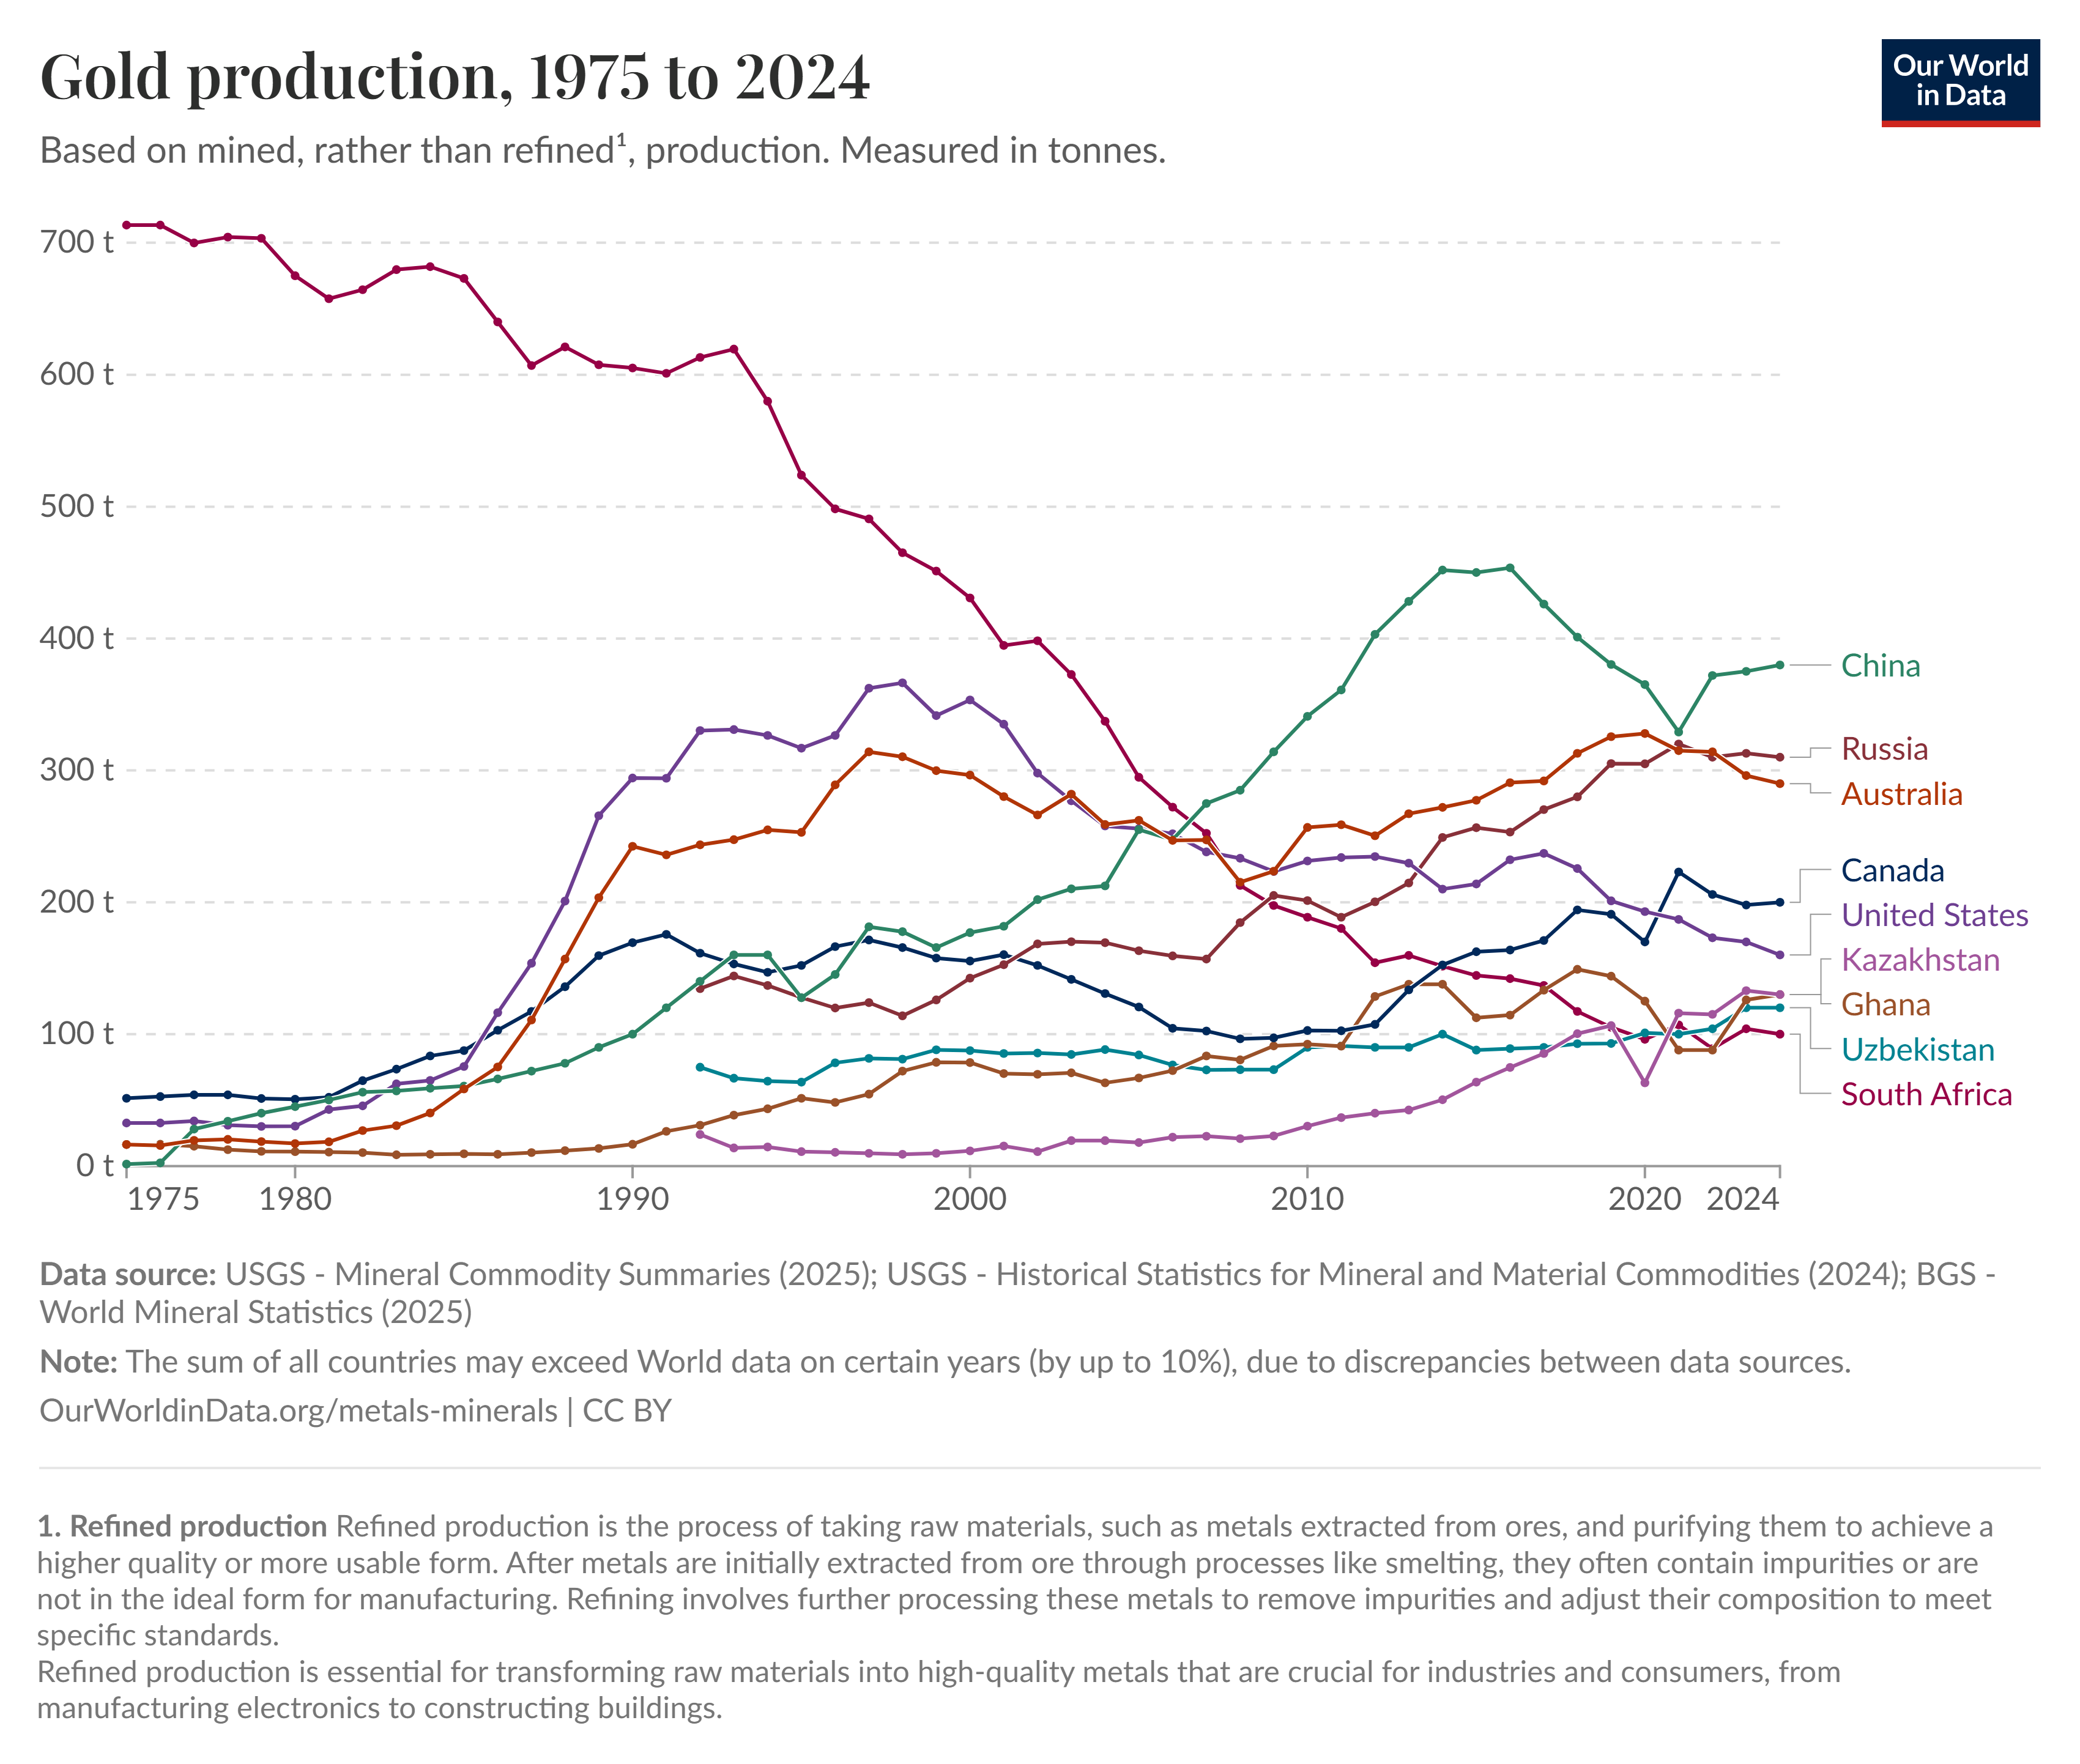
In 1975, South Africa was the undisputed anchor of the global gold market. According to data from Our World in Data, the nation mined an incredible 713.447 tonnes that year, towering over every other country on the globe. However, as surface-level ores were aggressively depleted, operators were forced to dig deeper. Reaching these extreme depths required complex engineering and vast capital, making the extraction process highly dangerous and economically unsustainable. By 2024, South Africa's output had contracted to just 100.0 tonnes, finalizing a steep, multi-decade downward trajectory.
China's Strategic Ascension to Number One
As South Africa's output waned, China's accelerated at a historic pace. In 1975, China’s gold production was virtually nonexistent on the global stage, sitting at exactly 1.5 tonnes. However, the data reveals a sustained, aggressive climb beginning in the 1990s and surging through the 2000s, reaching an all-time peak of 453.49 tonnes in 2016. Driven by deliberate government funding and the deployment of modernized mining technology to meet massive domestic demand, China's strategic overhaul successfully secured its position as the world leader, stabilizing at 380 tonnes by 2024.
The Modern Diversified Supply Landscape
The decline of a single dominant producer has given way to a highly geographically diversified supply chain. Today, the burden of global supply rests on several major players that have scaled up their operations over the last 50 years. For example, Australia grew its output from 16.386 tonnes in 1975 to 290 tonnes in 2024, closely trailing Russia's 310 tonnes. North America remains a critical hub, with the United States growing from 32.729 tonnes (1975) to 160 tonnes (2024), and Canada mining 200 tonnes. Emerging strongholds like Kazakhstan (130t), Ghana (130t), and Uzbekistan (120t) have all surpassed South Africa's modern output.
Conclusion: The Geological Reality of Supply
The precise 50-year dataset underscores a stark reality in resource extraction: surface abundance is temporary. South Africa’s transition from a 713-tonne behemoth to a 100-tonne minor player illustrates the harsh economics of deep-level mining. Conversely, China’s growth from 1.5 tonnes to 380 tonnes proves that state-backed capital and modernized infrastructure can successfully unlock and scale new supply. The era of single-nation dominance is permanently over, replaced by a highly diversified, technologically intensive global network required to feed the world's unrelenting demand for gold.