Precious Metals
October 13, 2025
3 min
Precious Metals
%20Main.avif)

Gold and silver are foundational precious metals, yet their market performance has not always been identical. An analysis of their price history reveals periods of both parallel growth and significant divergence.
This article provides a review of the percentage gains for gold and silver from a common 1999 baseline, as illustrated in the accompanying infographic. The chart uses 1999 as a baseline (0%) to enable a direct comparison of the metals' long-term performance. Each data point on the chart represents the total percentage gain from this specific starting date.
Historical Uptrend (2001-2011)
The first major precious metals cycle of the 21st century saw strong performance for both metals. The data shows:
- Both metals began a sustained price appreciation in the early 2000s.
- In the latter part of the cycle, particularly from 2009 to 2011, silver’s price appreciation accelerated.
- By the cycle's peak in 2011, silver's total percentage gain from the 1999 baseline had exceeded that of gold.
Performance during this uptrend: Silver +1,126% and Gold +660%.
Current Uptrend (2016-Present)
The market cycle beginning circa 2016 has shown a different dynamic. While both metals have appreciated relative to the 1999 baseline, their performance has diverged. Since that time, gold’s percentage gain from the 1999 baseline has been greater than that of silver, resulting in the wide separation between the two lines on the right side of the chart.
Performance during this uptrend: Gold +491% and Silver +271% (as of October 9).
Factors Behind Performance Differences
Historical price differences can be understood by examining the distinct fundamentals of each metal:
- Sources of Demand: Gold is primarily a monetary asset held as a store of wealth. Silver has a dual role, with significant demand from industrial applications (such as electronics and solar energy) in addition to its monetary function.
- Market Scale: The global silver market is substantially smaller than the gold market, a factor which can contribute to higher price volatility.
Conclusion
A review of the past 25 years shows that the performance relationship between gold and silver is dynamic. The historical data illustrates a past cycle where silver's appreciation ultimately surpassed gold's, which contrasts with the current cycle where a performance gap in favor of gold has been observed. This historical information provides a factual context for viewing the precious metals market today.
Sponsored by:

Outcrop Silver is a leading explorer and developer focused on advancing its flagship Santa Ana high-grade silver project in Colombia. Leveraging a disciplined and seasoned team of professionals with decades of experience in the region. Outcrop Silver is dedicated to expanding current mineral resources through strategic exploration initiatives.
At the core of our operations is a commitment to responsible mining practices and community engagement, underscoring our approach to sustainable development. Our expertise in navigating complex geological and market conditions enables us to consistently identify and capitalize on opportunities to enhance shareholder value.
With a deep understanding of the Colombian mining landscape and a track record of successful exploration, Outcrop Silver is poised to transform the Santa Ana project into a significant silver producer, contributing positively to the local economy and setting new standards in the mining industry.
Learn more about Outcrop Silver at https://outcropsilver.com/
Source: tradingview.com
Disclaimer: This infographic and accompanying article are provided for informational and illustrative purposes only and should not be construed as financial, investment, or professional advice. They are not an offer to sell or a solicitation to buy any securities. Investing in precious metals and securities involves inherent risks, including the risk of loss, and past performance is not indicative of future results. Market data, statistics, and analysis are based on publicly available information from third-party sources believed to be reliable, but their accuracy and completeness cannot be guaranteed. Readers should conduct their own due diligence and consult with a qualified financial advisor before making any investment decisions.




Explore More
View All

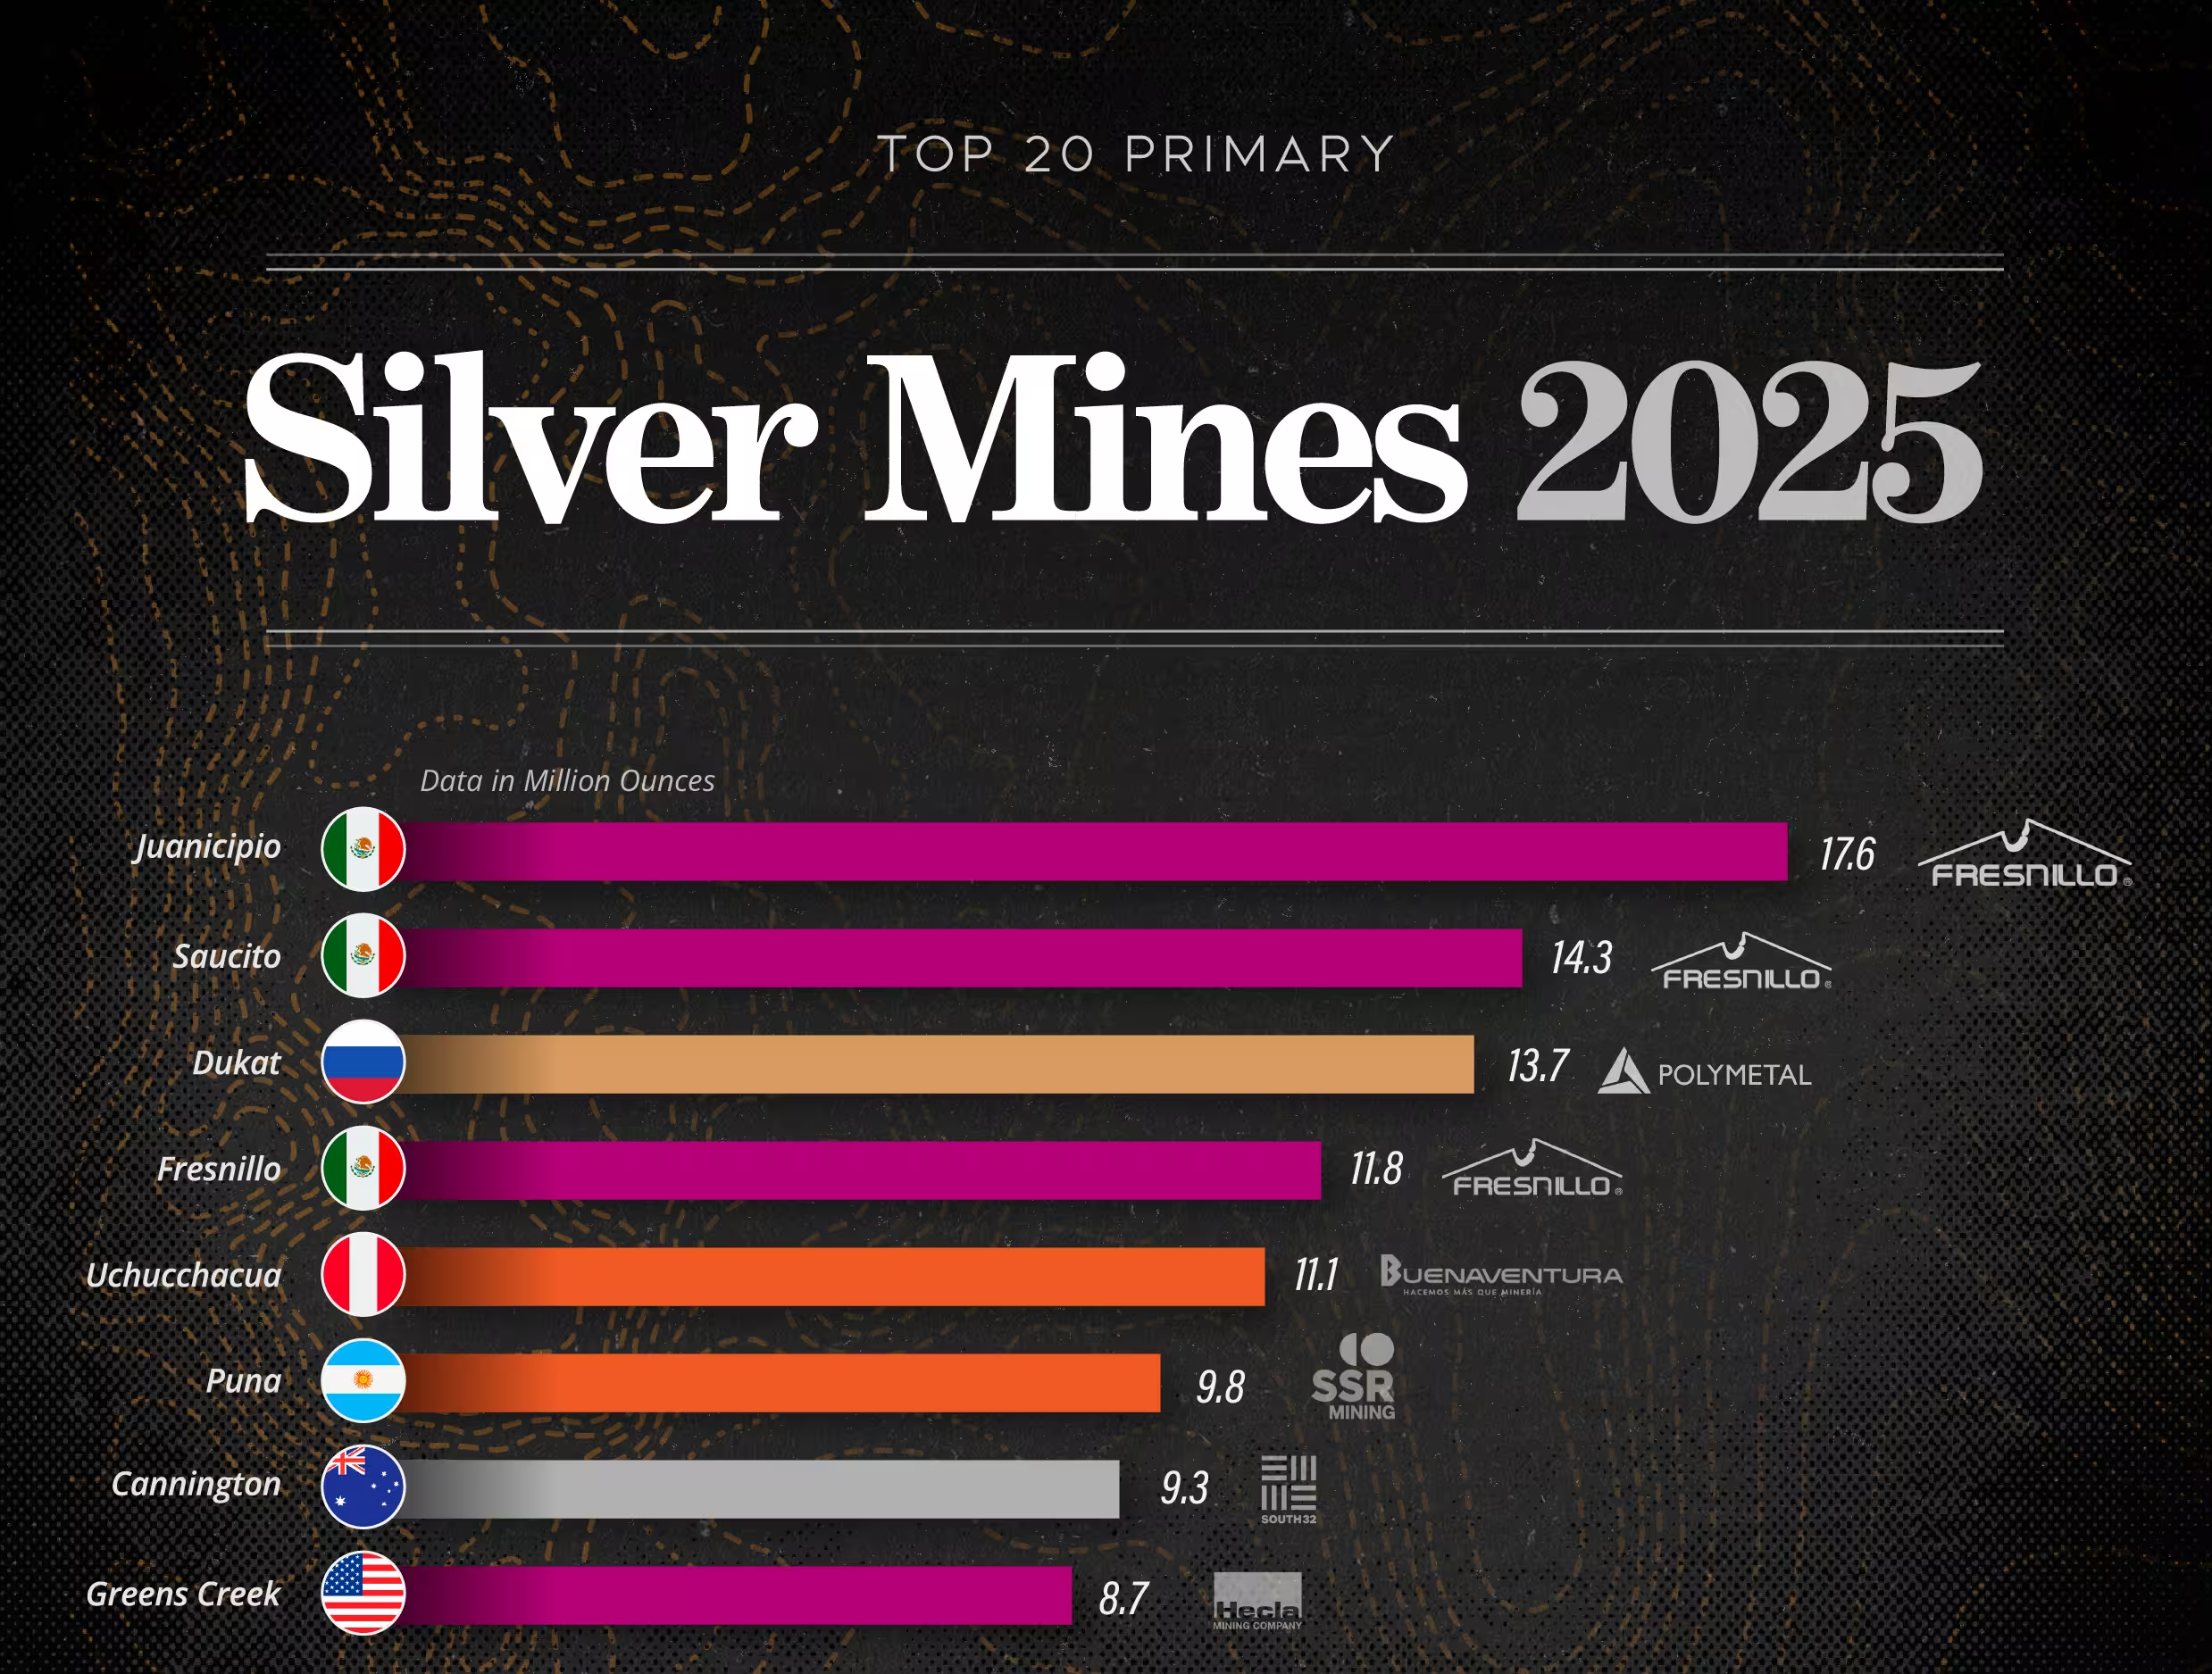
The World's 20 Largest Primary Silver Mines by 2025 Output
The World's 20 Largest Primary Silver Mines by 2025 Output
The single largest source of primary silver is a young mine in the Mexican state of Zacatecas. Juanicipio put out 17.6 million ounces in 2025, more than any other mine that earns its keep from silver itself rather than pulling it out as a byproduct of lead, zinc and gold. Fresnillo operates it and owns 56%; the other 44% changed hands in September 2025, when Pan American Silver completed a US$2.1 billion takeover of MAG Silver.
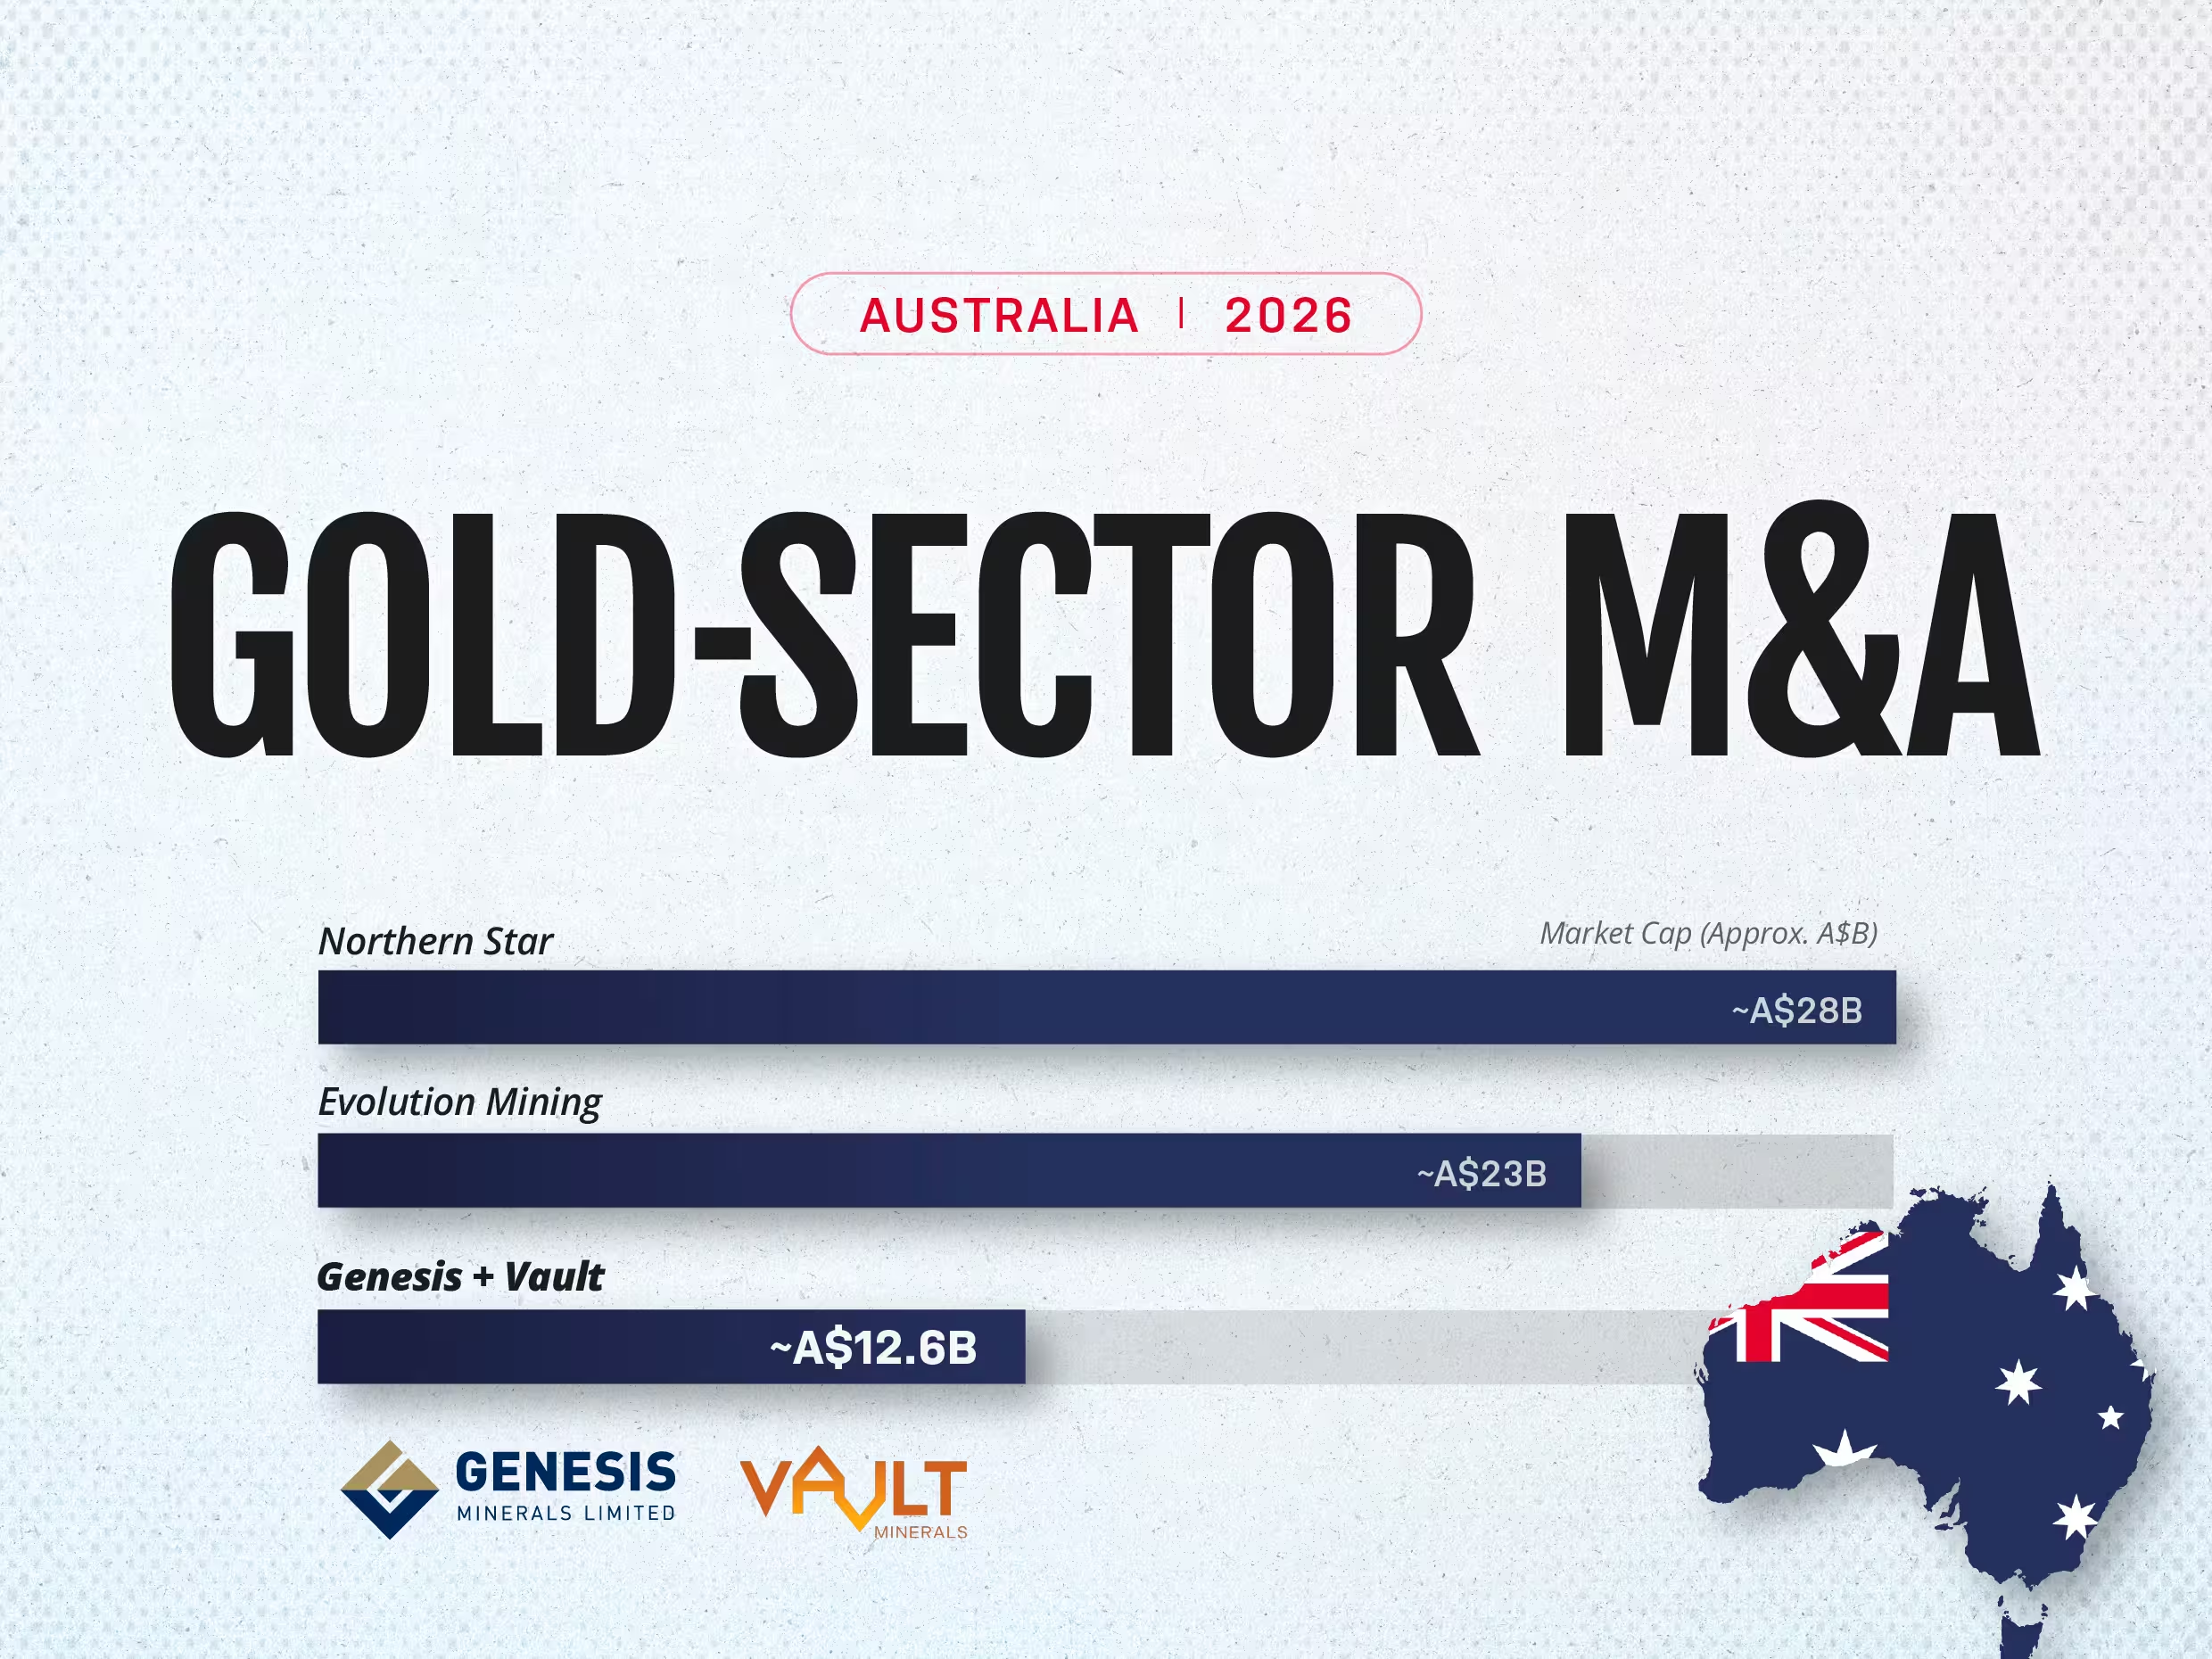
Gold's Record Run Has Set Off a Wave of Mining Mergers
Gold's Record Run Has Set Off a Wave of Mining Mergers
Gold hit an all-time high of about US$5,595 an ounce in January 2026 before settling near US$4,000, still far above the levels of a few years ago. That combination, record prices followed by a stable, still-profitable pullback, has done something a straight rally rarely does: it has opened a merger window.
.webp)
Three Ancient Belts Carry Ghana's Gold, and Investment Keeps Flowing to Them
Three Ancient Belts Carry Ghana's Gold, and Investment Keeps Flowing to Them
In March 2026, one of Ghana's own mining companies said it would invest about $1.2 billion in its operations at the Tarkwa and Damang gold mines. Both sit on the Ashanti belt, one of three narrow bands of ancient rock that carry almost all of Ghana's gold.
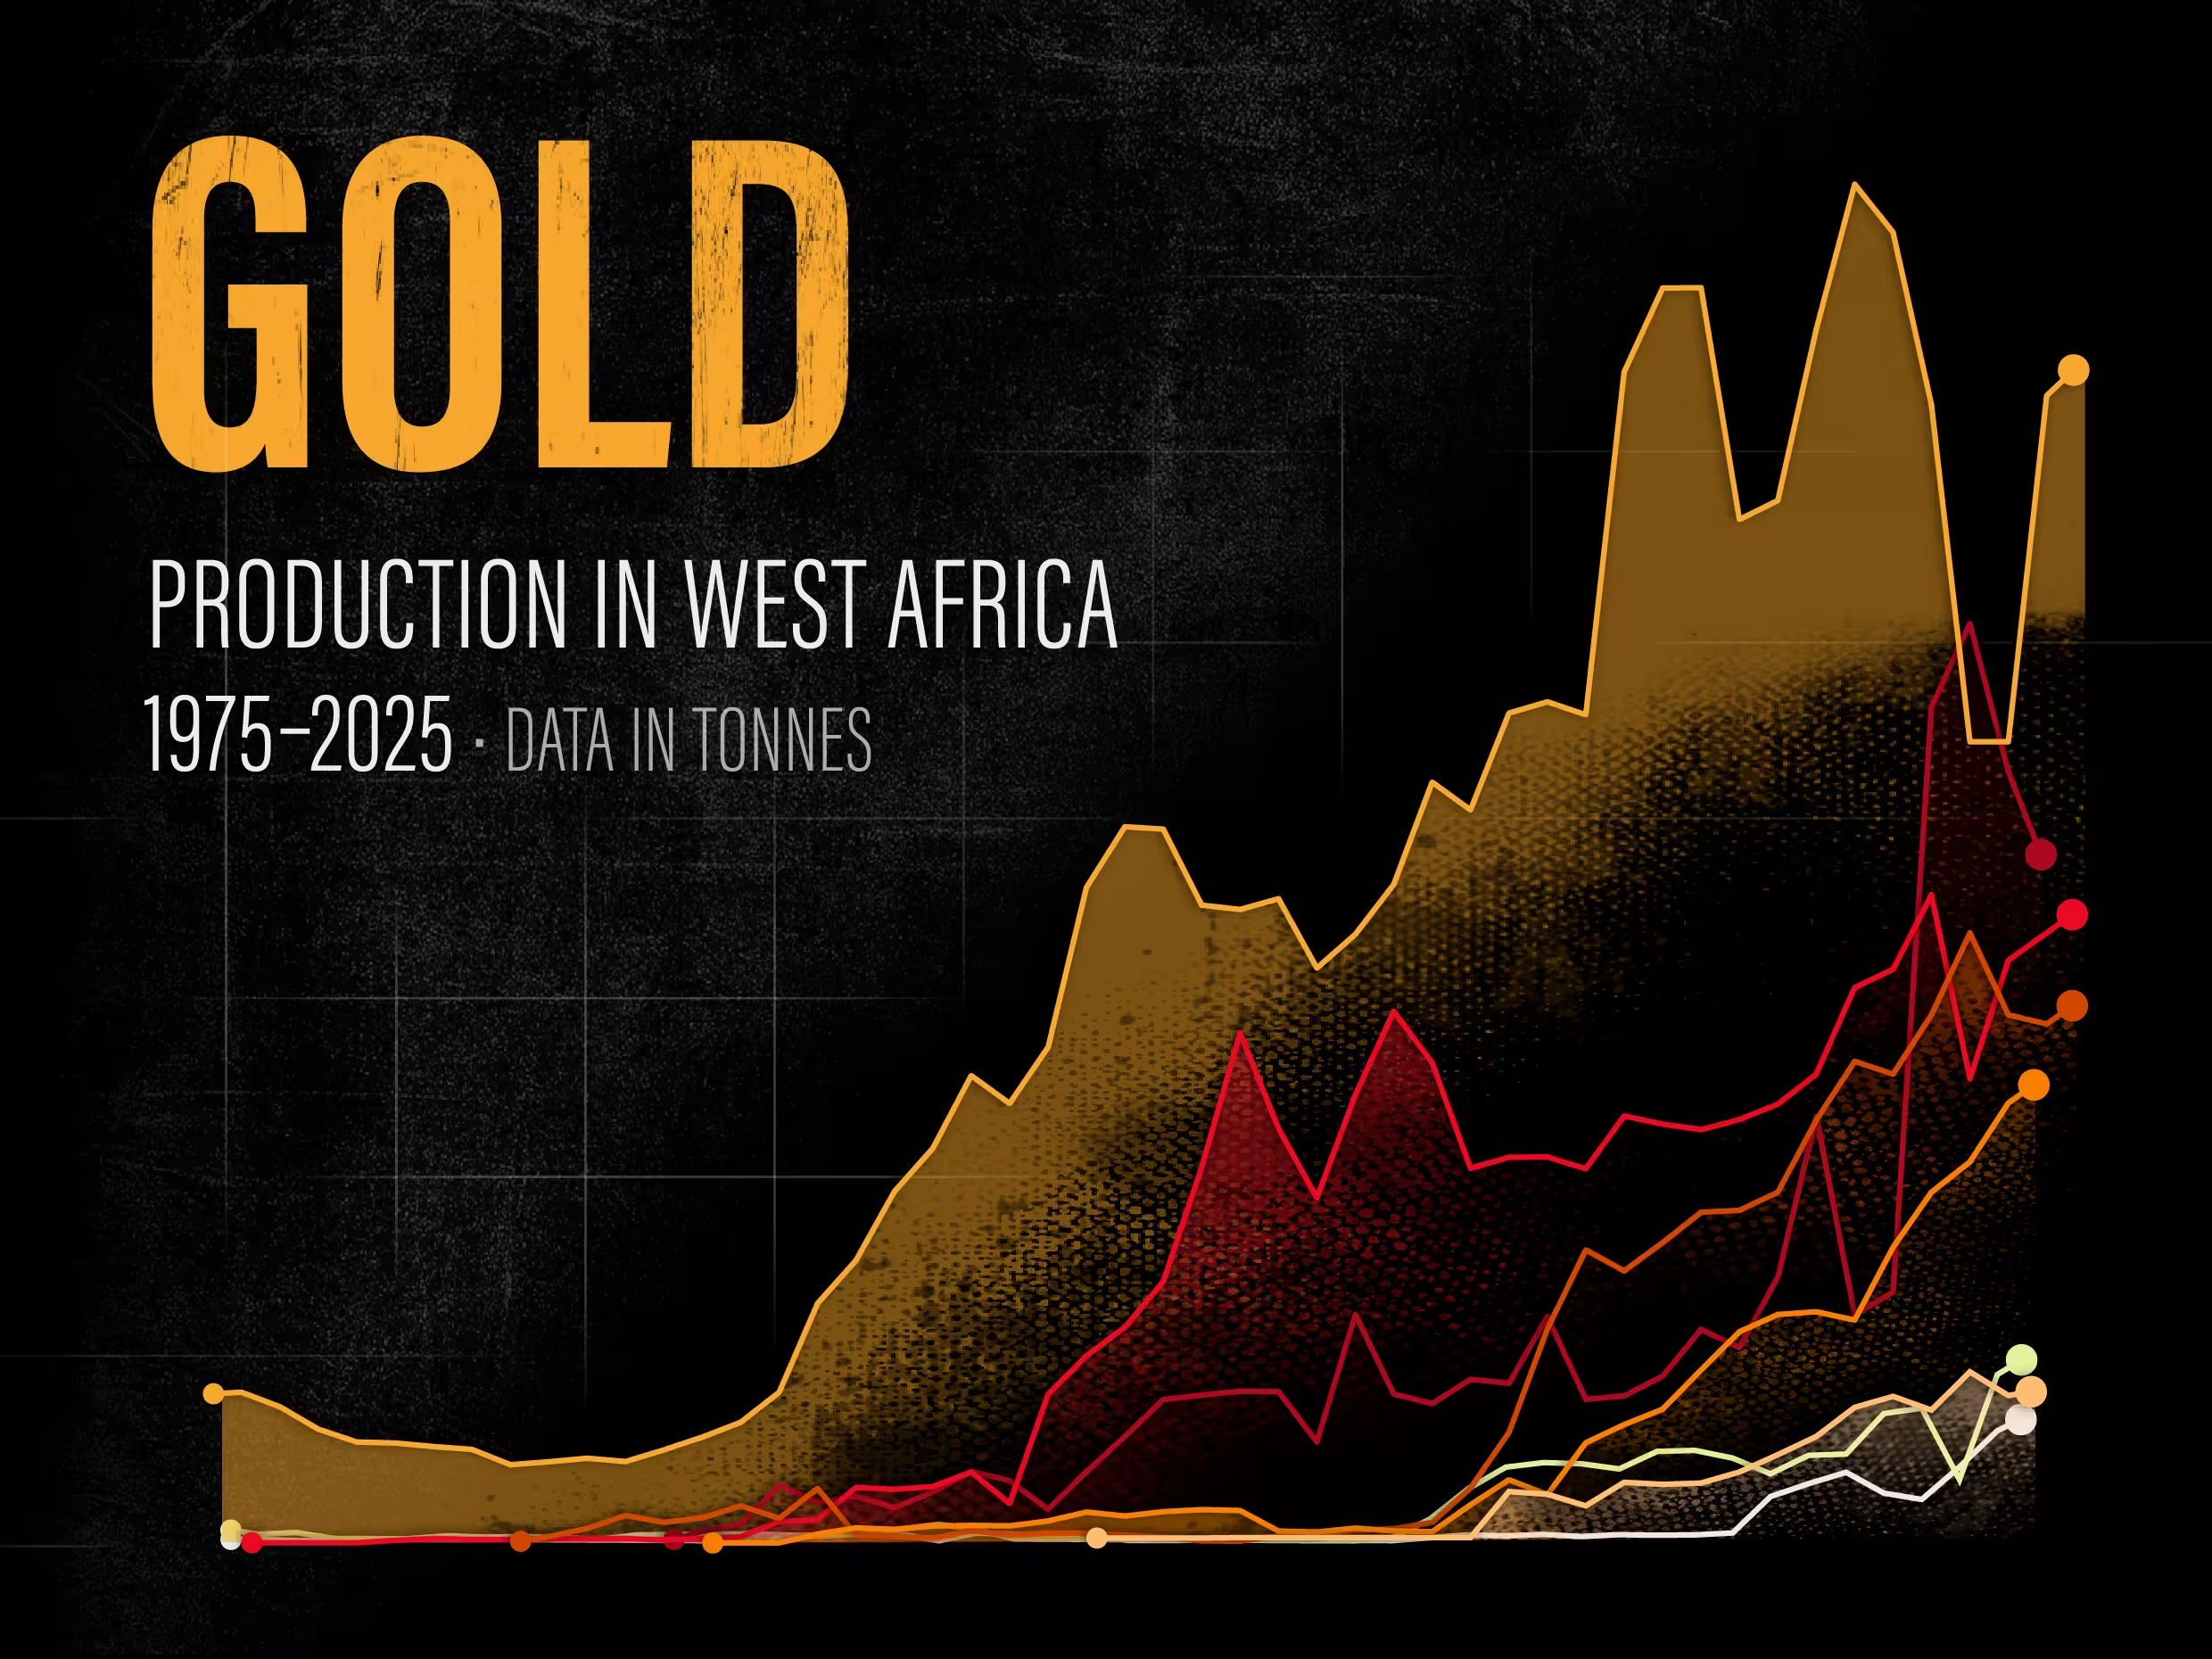
Charted: Fifty Years of Gold Production in West Africa
Charted: Fifty Years of Gold Production in West Africa
West Africa is in the middle of a gold run. In 2025 Ghana's output climbed more than 23 percent to a record 5.94 million ounces, holding its place as Africa's largest producer and now the sixth-largest in the world, and analysts expect the wider region to rebound about 8 percent in 2026.