Precious Metals
October 8, 2025
5 min
Precious Metals
Gold reached a new milestone on October 8, 2025, trading above $4,000 per ounce for the first time. This new price level is drawing significant attention to the gold market and the producers who supply it.
With prices at an all-time high, the operational performance of mining companies becomes particularly relevant. Recently released production data for the second quarter of 2025 offers timely insight into which producers were increasing their output ahead of this price rally.
Top Producers: A Story of Stability and Strategic Moves
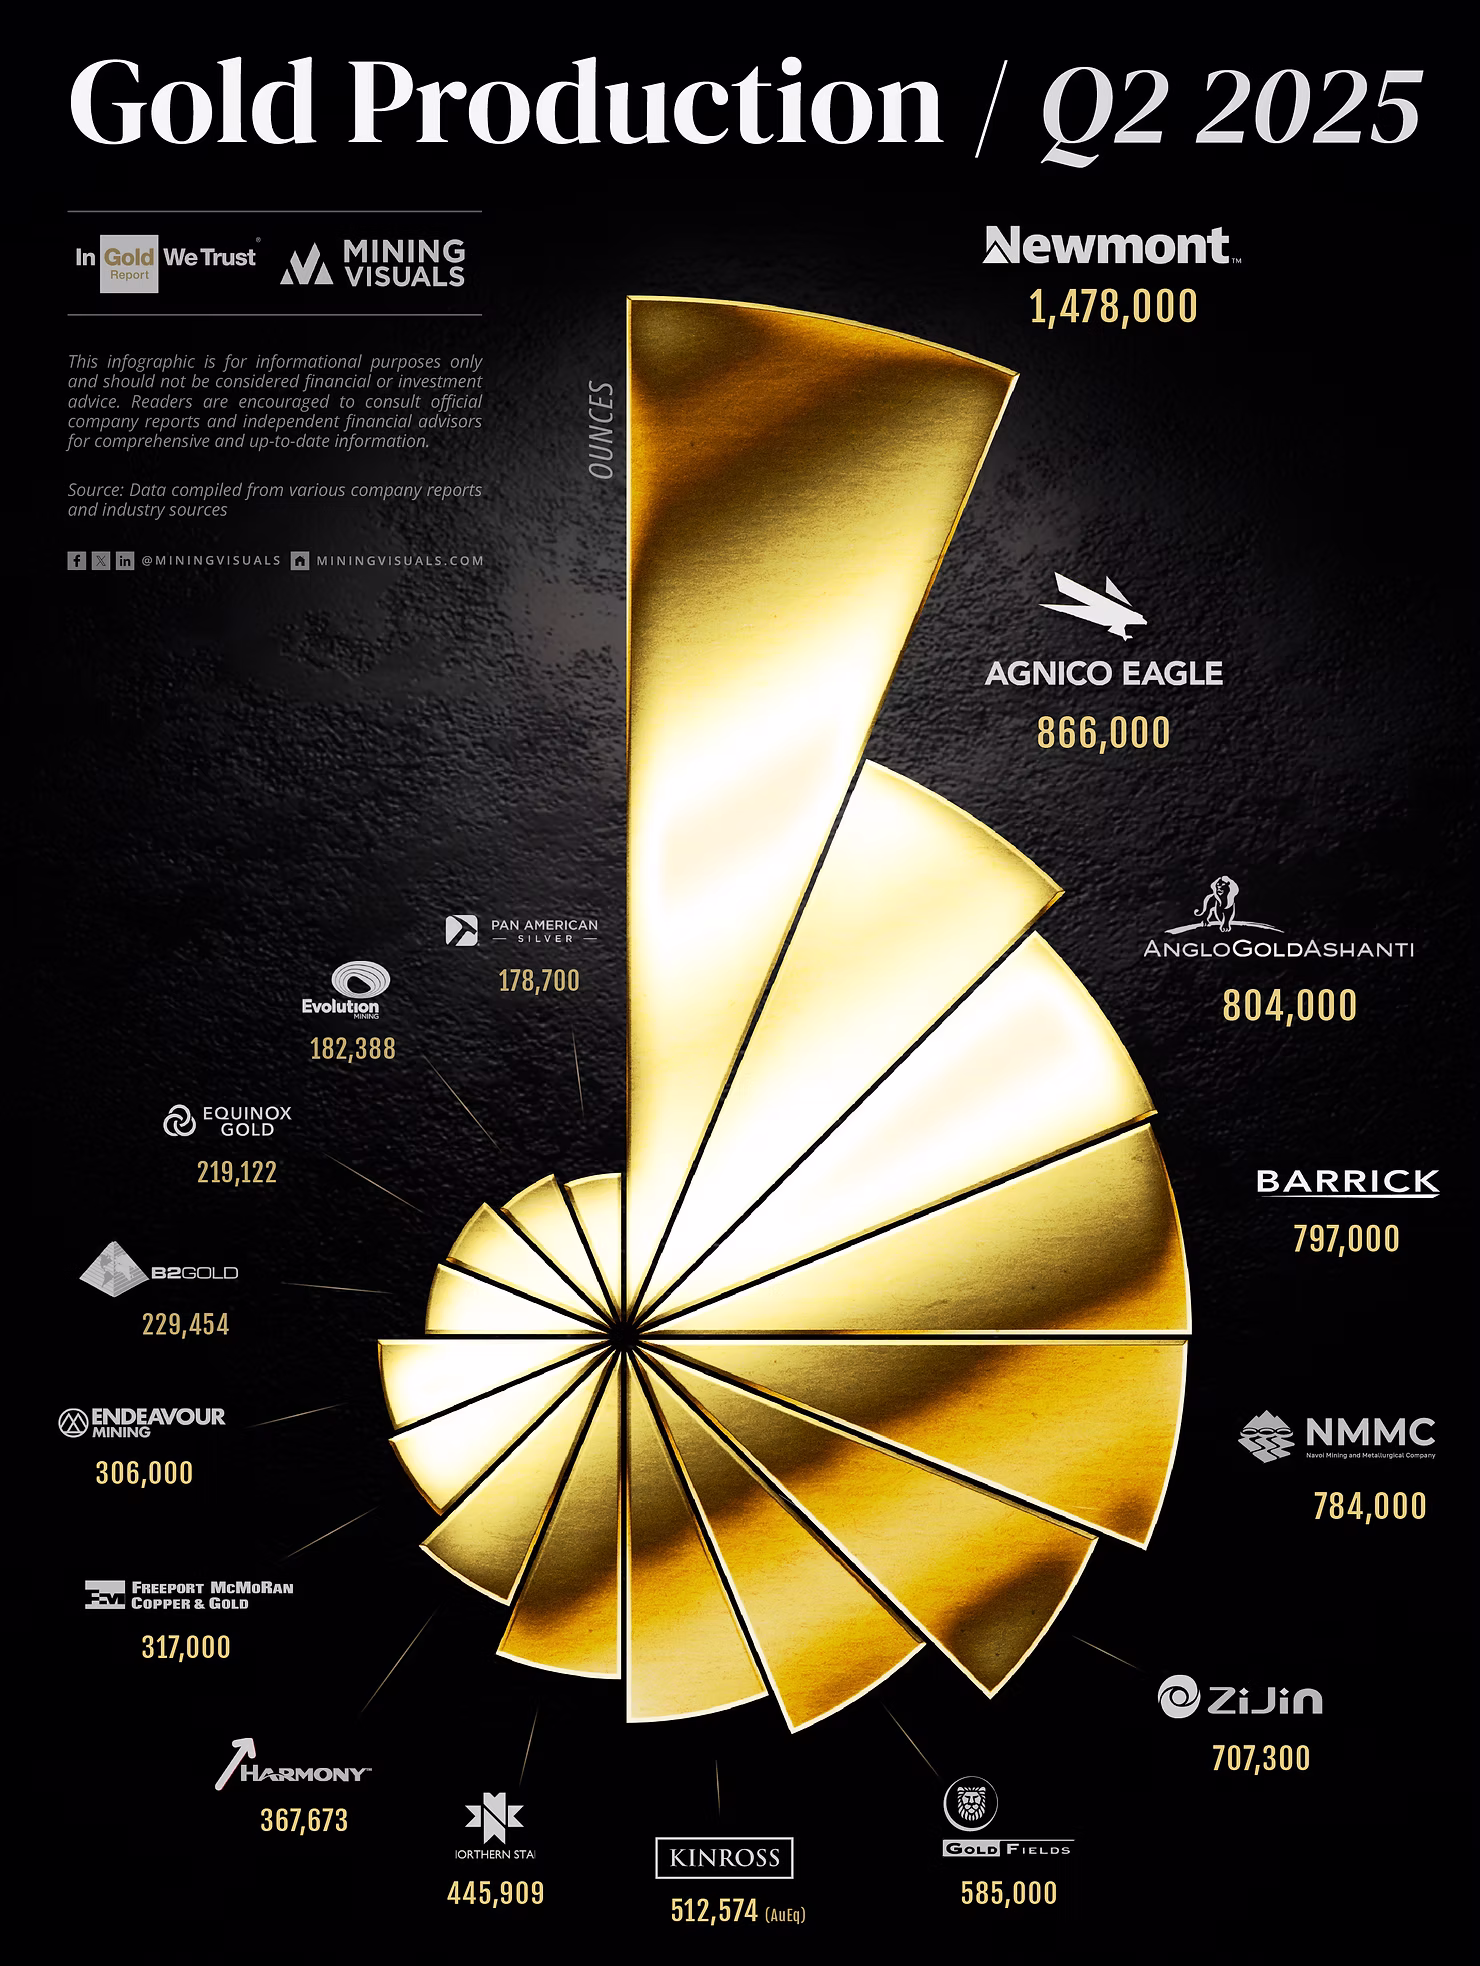
Newmont's gold production for the three months ended June 2025 (Q2 2025) decreased, a decline that was a planned result of the company's strategic decision to optimize its global portfolio.
The reduction was primarily due to two factors:
- Strategic Asset Divestments: The decrease was driven by the previously announced closing of non-core asset sales Source, as Newmont focused exclusively on its highest-value "Tier-1" assets Source.
- Mine Sequencing: Production was also reduced by planned mine sequencing at key operations, including Boddington and Tanami, where the company accessed lower-grade zones as part of its long-term strategy Source.
Crucially, the drop in volume did not hurt Newmont's financials. It was offset by record-high gold prices and disciplined cost control, resulting in record quarterly free cash flow Source.
Agnico Eagle Mines Limited reported a modest decrease (approximately 3.3%) in gold production in the three months ended June 30, 2025 (Q2 2025), compared to the prior-year period. However, this planned reduction was paired with record financial performance. The slight production drop was primarily attributed to:
- Operational Sequencing: Lower gold production from the Meadowbank operation, due to a longer-than-expected caribou migration affecting both mining and milling operations Source.
- Lower Grades/Throughput: Reduced output from Fosterville and Canadian Malartic due to lower grades and throughput Source. This was partially offset by strong production at Macassa and LaRonde.
Despite the minor dip in volume, the company generated record quarterly free cash flow ($1.3 billion) Source, driven by a high realized gold price and strong operational execution Source. The company also strengthened its financial position, moving to a net cash position during the quarter Source.
AngloGold Ashanti reported a substantial 21% year-over-year increase in gold production, reaching 804,000 ounces in Q2 2025 Source. This strong growth was primarily driven by:
- Obuasi Mine Ramp-Up: The successful ramp-up of the Obuasi mine in Ghana to full commercial production, which saw a 31% increase in output Source.
- Geita Performance: Continued strong operational results and grade improvements at the Geita mine in Tanzania Source.
- Asset Addition: The first full-quarter contribution from the recently acquired Sukari gold mine in Egypt Source.
Capitalizing on the higher production volumes and a 41% increase in the average realized gold price Source, the company's financials soared:
- Free Cash Flow rose by 149% to $535 million Source.
- Adjusted Net Debt was significantly reduced by 92% Source, dramatically strengthening the balance sheet.
Other Notable Performances
Several other producers delivered impressive growth in the second quarter.
Gold Fields PLC
- Production: Q2 production improved by 28% compared to the same period last year.
- Key Driver: Driven by the Salares Norte mine (Chile) achieving full production capacity Source.
- Financial Impact: Generated major free cash flow of $952 million Source.
Equinox Gold Corp.
- Production: Q2 volume increased 79.28% compared to the same period last year due to strategic expansion.
- Key Driver: Boosted by the acquisition of Calibre Mining and continued operational improvements at the Greenstone mine Source.
- Financial Impact: Adjusted EBITDA climbed 344% to $200.5 million Source.
Endeavour Mining PLC
- Production: H1 2025 production grew 38% over the previous year Source.
- Key Driver: Attributed to the full contribution of an expanded portfolio and processing of higher-grade ore at Houndé Source.
- Financial Impact: Delivered record H1 free cash flow of $514 million Source.
B2Gold Corp.
- Production: Q2 volume of 229,454 ounces, 12.34% higher than the same quarter last year Source.
- Key Driver: Strong performance exceeding expectations at the Fekola, Masbate, and Otjikoto mines Source.
- Financial Impact: Operating cash flow was strong at $301 million, and the company maintained low cash cost guidance Source.
Producers Navigating Operational Headwinds
Some of the industry's biggest names navigated challenges that led to production declines.
Freeport-McMoRan Inc.
- Production: Saw the steepest decline in gold production among major producers at 28.44% year-over-year Source.
- Key Driver: A planned strategic shift at the Grasberg mine (Indonesia), resulting in a transition to a different ore body with lower gold grades Source.
- Financial Impact: Production issues were later compounded by a deadly mudslide, leading the company to cut copper and gold sales forecasts for Q3 Source.
Pan American Silver Corp.
- Production: Gold production slid 19% year-over-year to 178,700 ounces Source.
- Key Driver: A combination of the sale of the La Arena mine (a gold asset) and lower grades at multiple sites impacting the gold segment Source.
- Financial Impact: The higher realized gold and silver prices led to record free cash flow of $233 million and a 134% surge in mine operating earnings Source.
Evolution Mining Ltd.
- Production: Reported a 14.00% year-over-year decrease in June quarter production Source. (Note: The company met its full-year guidance, with the quarterly drop reflecting sequencing)
- Key Driver: Reflected mine sequencing priorities, including the processing of lower-grade stockpiles at the Cowal mine and stripping activities to prepare future mining areas Source.
- Financial Impact: Achieved record net profit and successfully reduced its debt gearing to 15% on strong financial year results Source.
Barrick Gold Corp.
- Production: Attributable gold production declined year-over-year (volume decreased 15.93% based on a broad industry report) Source. (Note: Barrick's Q2 was actually up 5% sequentially from Q1, but down year-over-year)
- Key Driver: The year-over-year challenge was primarily due to scheduled maintenance shutdowns at the Carlin complex and grade variability at the Kibali mine Source.
- Financial Impact: The strong gold price environment drove Free Cash Flow up 107% from the prior year, leading to the highest adjusted earnings per share since 2013 Source.


Explore More
View All

Solar Is Silver's Largest Industrial Market, and Not Easily Replaced
Solar Is Silver's Largest Industrial Market, and Not Easily Replaced
When LONGi Green Energy, the world's largest solar module maker, told investors on January 5, 2026 that it would begin mass-producing base-metal solar cells in the second quarter, it put a number on a pressure the whole industry feels. Solar is the largest single application within silver's industrial demand, and as the metal ran to a record above $121 an ounce in January, rising silver costs pushed manufacturers to accelerate efforts to reduce the metal per cell.

Silver in the Data Center: How AI's Power Crunch Is Building a New Pillar of Industrial Demand
Silver in the Data Center: How AI's Power Crunch Is Building a New Pillar of Industrial Demand
In early 2026, the artificial intelligence narrative shifted abruptly from software capabilities to physical hardware constraints. With tech giants committing hundreds of billions to new infrastructure—pushing global hyperscaler capital expenditures past $600 billion this year—the industry has collided with a new primary bottleneck: a severe power and thermal crunch.

Silver's Use Cases: A Visual Guide to Where the Metal Actually Goes
Silver's Use Cases: A Visual Guide to Where the Metal Actually Goes
Somewhere inside a pressurized-water reactor, an alloy that is four-fifths silver is absorbing neutrons to keep the core in check, a job most silver investors have never heard of. It is a useful reminder that the metal people picture as coins and jewelry mostly works elsewhere, across industry.

Ranked: The Countries That Produced the Most Silver in 2025
Ranked: The Countries That Produced the Most Silver in 2025
Mexico remained the world's top silver-producing country in 2025, mining 172.9 million ounces (Moz), roughly a fifth of global supply, according to the World Silver Survey 2026, produced for the Silver Institute by Metals Focus. But Mexico's lead narrowed: its output fell 5% for a third straight year, while second-place Peru climbed 7%. Global mine production rose 3% to 846.6 Moz, even as the ranking's top tier told a story of one leader sliding and its closest rival closing in.