Copper
May 19, 2025
2 min
Copper
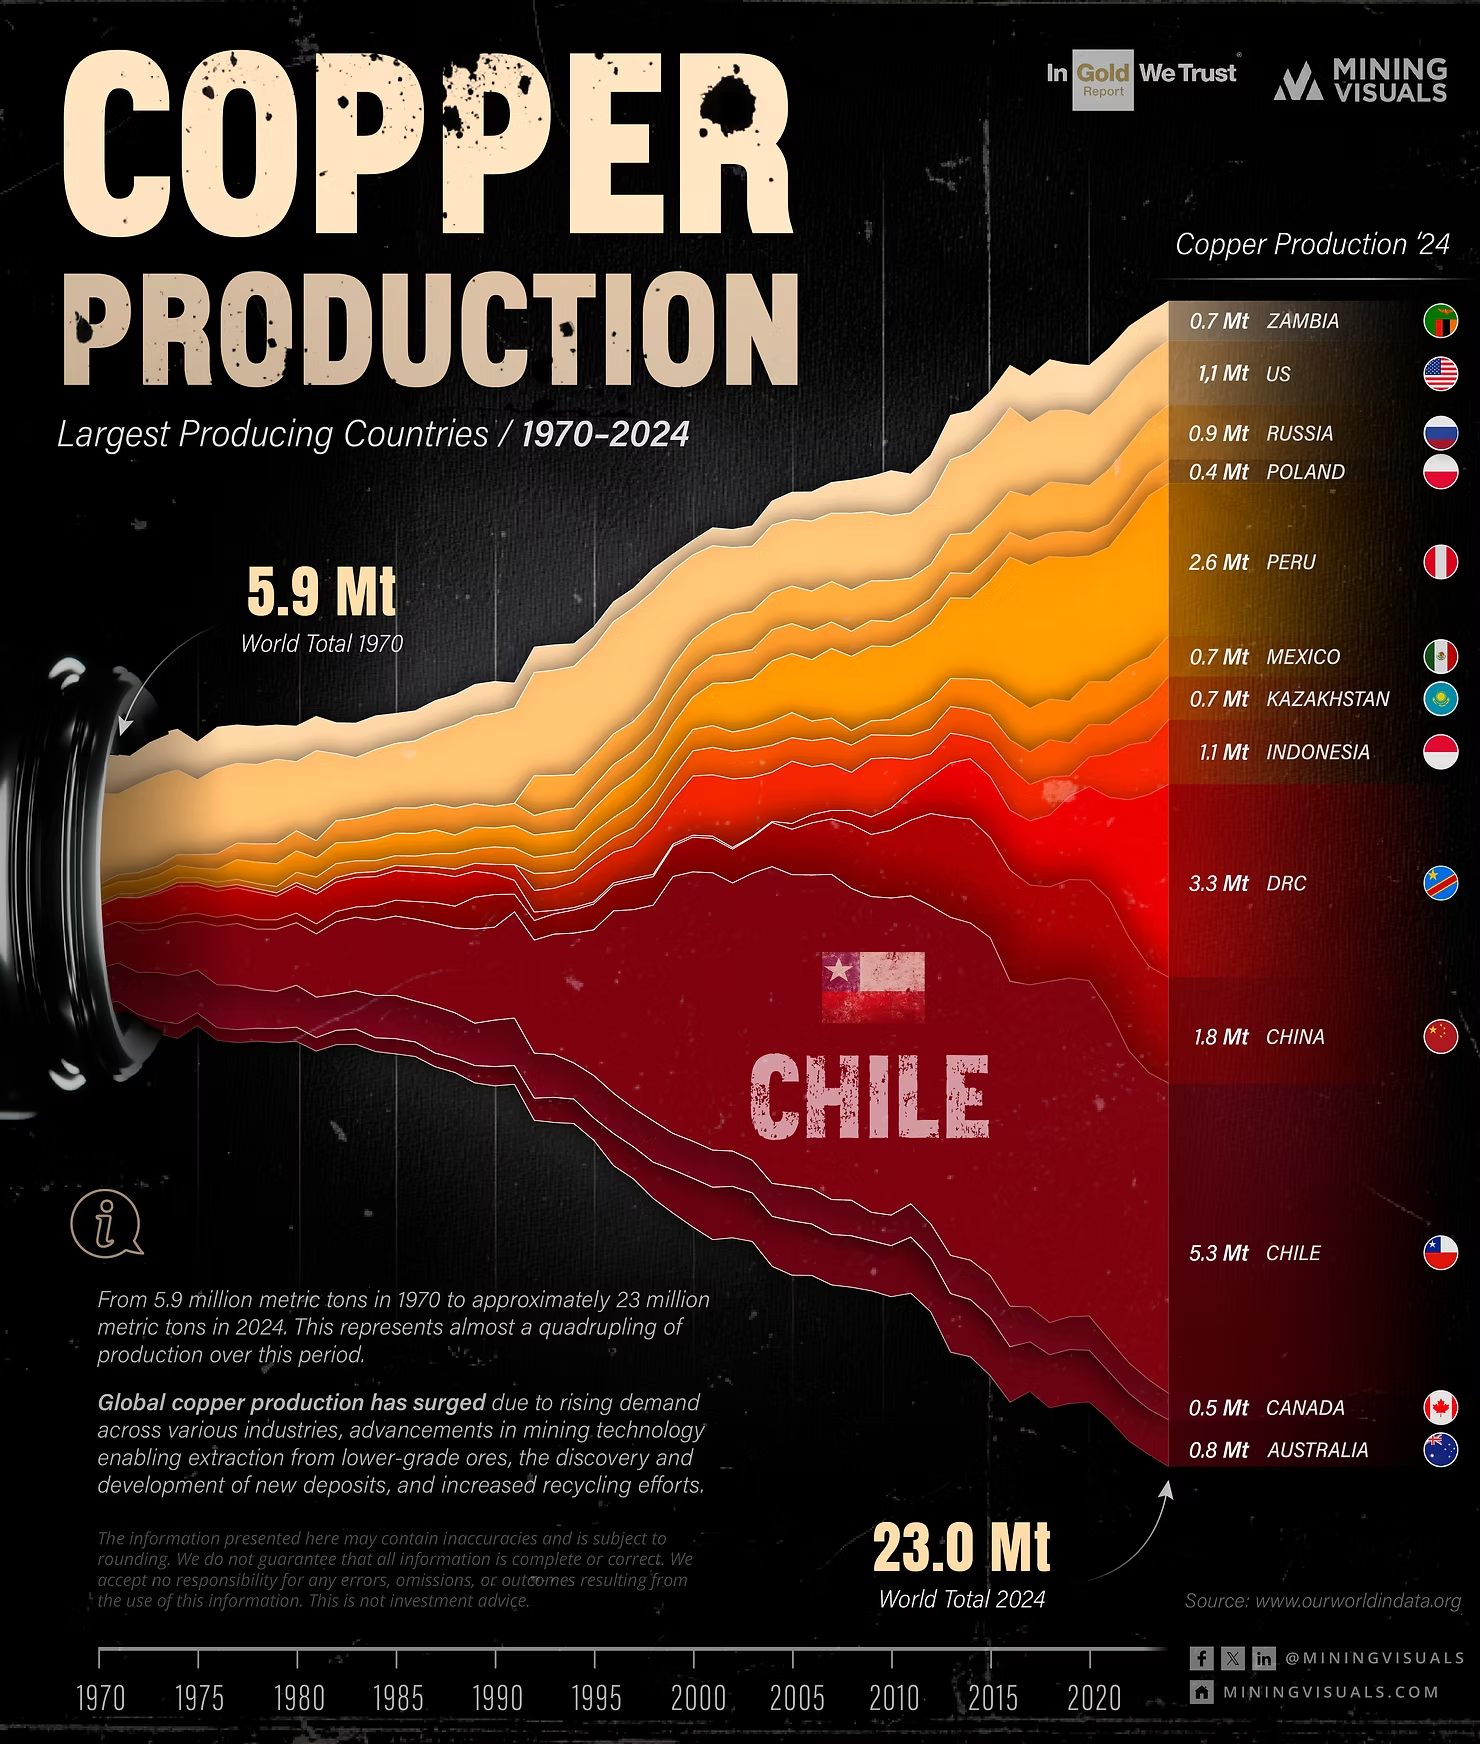

In 1970, the world’s copper mines produced approximately 5.9 million metric tons. By 2024, that figure is estimated to have surged to around 23 million metric tons—a more than threefold increase.
This dramatic growth has been driven by global industrialization, the electronics boom, and—more recently—the green energy transition, which depends heavily on copper for everything from electric vehicles to renewable energy infrastructure.
Who Mines the World's Copper?
The league of top copper-producing nations looks very different today than it did five decades ago:
- The Americas Lead: Chile has surged to become the global leader, now accounting for over a quarter of the world's mined copper (5.3 Mt annually). Neighboring Peru has also risen to become a top global producer. In contrast, the United States, a dominant producer in 1970, now has a smaller global share, though it remains a key contributor.
- New Powerhouses Emerge: The Democratic Republic of Congo (DRC) has seen a dramatic recent rise, leveraging its high-grade deposits to become a top-three producer. China has also significantly increased its mine output, alongside becoming the world's largest copper consumer.
- Steady Players: Nations like Australia and Russia have maintained their status as important and relatively consistent copper producers.
Why the Big Changes?
Several factors have redrawn the copper map:
- New Discoveries & Geology: The unearthing of vast, high-quality deposits in regions like South America fundamentally shifted production potential.
- Technological Leaps: Advances in mining and processing have made it possible to economically extract copper from lower-grade ores, expanding reserves.
- Economic Forces: Global copper prices, investment climates, and production costs have dictated where new mining ventures thrive.
- Political & Policy Landscapes: Nationalizations in the 1970s, followed by shifts in investment laws and varying political climates in mining nations, have played a significant role.
Recycling's Growing Role
While mine production tells a big part of the story, copper recycled from scrap (secondary production) is increasingly vital. It helps meet overall demand, conserves resources, and supports a more sustainable copper lifecycle.
The information provided in this article is for general informational purposes only and is based on publicly available data and estimates as of May 2025. Figures for historical production, and especially for recent years like 2024, are estimates and may be subject to revision by official sources. This article does not constitute financial, investment, or trading advice; readers should conduct their own research and consult with professionals before making any decisions based on this information.
General Sources:
The information synthesized in this article draws from data and reports typically compiled and published by organizations including:
- U.S. Geological Survey (USGS): Particularly their annual Mineral Commodity Summaries and historical mineral statistics.
- Our World in Data: Which often aggregates and visualizes data from sources like the USGS and the British Geological Survey (BGS).
- British Geological Survey (BGS): For world mineral statistics.
- Reputable industry publications, mining sector news outlets, and historical analyses of the copper market.
Specific data points for top producing countries in recent years are often cross-referenced with publicly accessible reports and encyclopedic sources that cite these primary geological surveys.





Explore More
View All

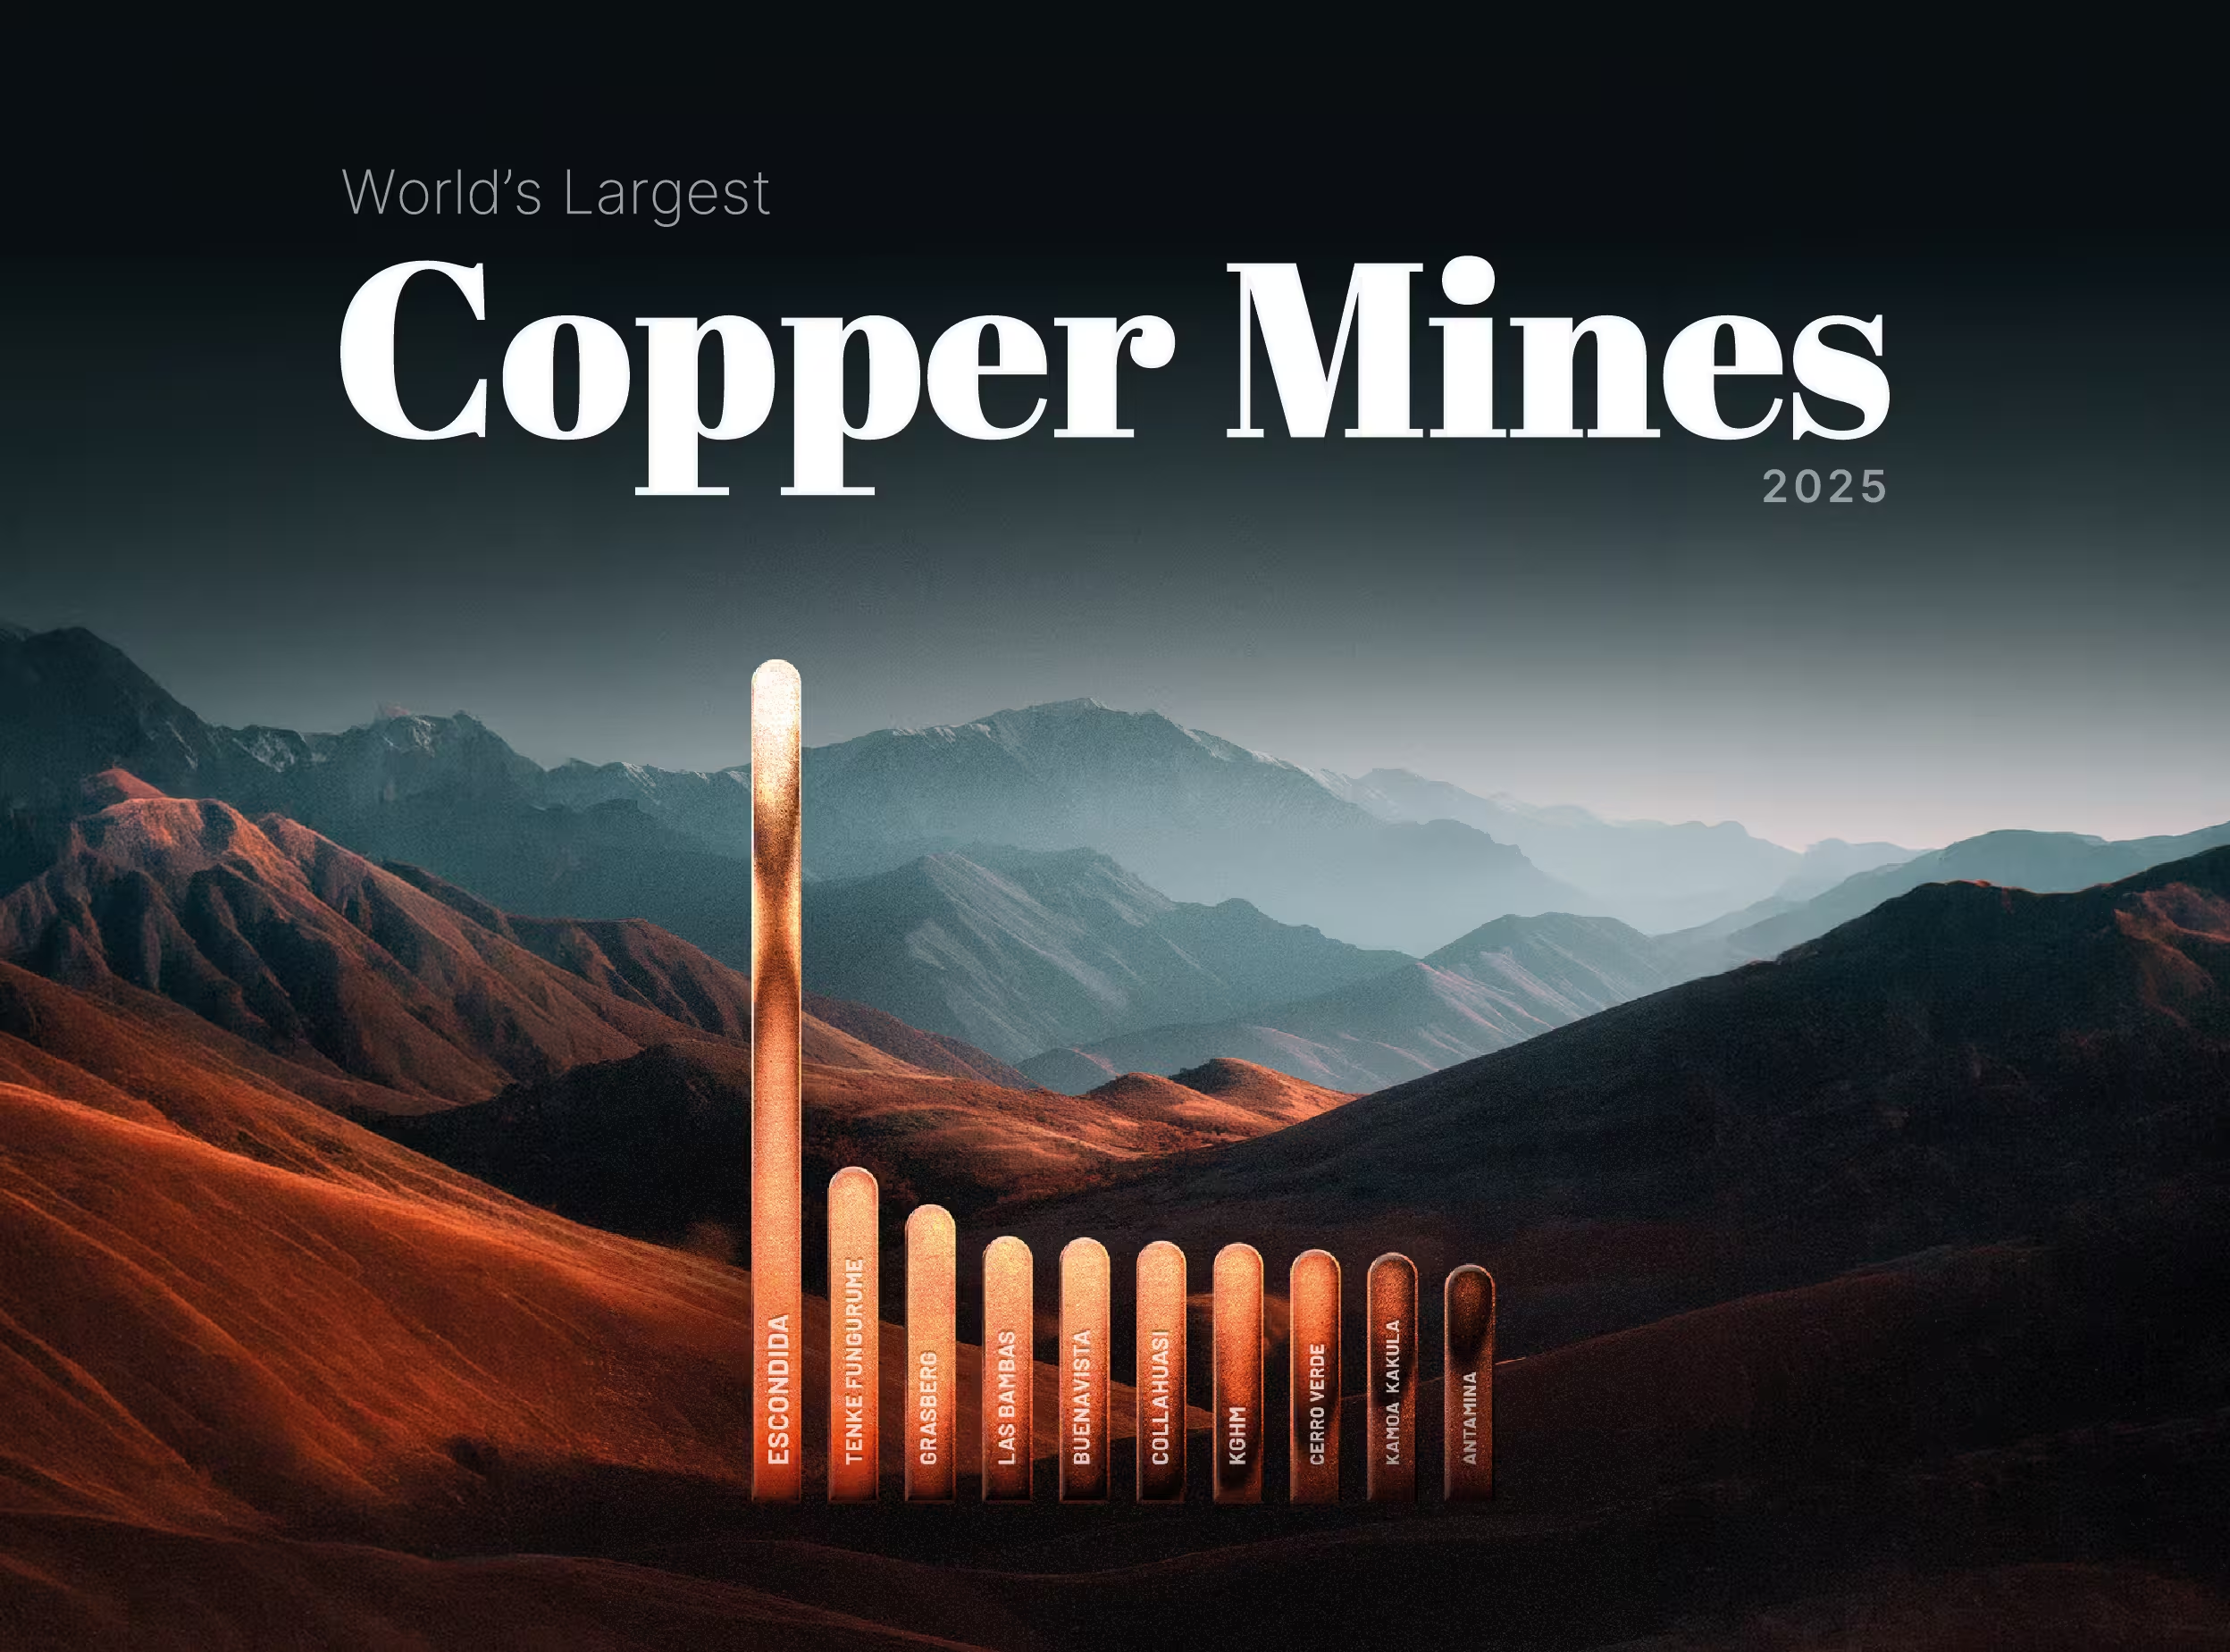
Ranked: The World's Largest Copper Mines (2025)
Ranked: The World's Largest Copper Mines (2025)
Copper has spent 2026 setting records, touching an intraday COMEX high of $6.71 per pound on May 13 amid AI-driven demand and supply shocks, against a backdrop where the ICSG now forecasts a 150,000-tonne deficit for 2026. In a market this tight, where the deficit thesis turns on lost tonnes, the question of where the world's copper actually comes from carries unusual weight.

Copper on Track for Its Highest Monthly Close on Record: A Look at the Drivers
Copper on Track for Its Highest Monthly Close on Record: A Look at the Drivers
Copper has spent most of 2026 doing something it had not done in a quarter century: setting fresh records every few weeks. The COMEX contract printed an intraday all-time high of $6.71 per pound on May 13, and the May monthly close looks set to land at the top of the historical chart. In London, copper traded above $14,000 per tonne in mid-May, touching $14,196.50, within reach of the LME's January 29 record of $14,527.50.

The Cost of Mining Copper: A 2024–2025 Update
The Cost of Mining Copper: A 2024–2025 Update
Copper futures touched an all-time high above $6.58 per pound on May 12, 2026, capping a 40.86% gain over the prior twelve months as supply tightness collided with structural demand from grid build-out, electric vehicles, and AI data centers. Earlier in the year, the LME benchmark rallied 22% to a record $13,387 per tonne on January 6, 2026. Behind the price action lies a less-discussed story: what it actually costs the world's largest miners to pull a pound of copper out of the ground.
Copper Production Q4 2025
Copper Production Q4 2025
As power-hungry AI data centers drive a projected 2-million-ton surge in global copper demand by 2030, market attention remains fixated on the supply side. Fourth-quarter 2025 metrics provide a definitive look at how the world's top miners closed out the year. While overall volumes remain heavily concentrated among a few historic industry giants, the true Q4 narratives emerged further down the list, as mid-tier producers leveraged flagship asset expansions to hit multi-year highs and offset the sector's ongoing struggle with declining ore grades.