Copper
June 27, 2025
3 min
Copper


Often called "the metal with a PhD in Economics," copper's price has long been a crucial barometer for industrial progress, global conflict, and technological revolution. From the first telegraph wires to the data centers and EVs of today, every major shift in our world is etched into the price of this critical metal. Below, we break down the key historical events that have defined the copper market and continue to shape its future.
Early Days: Industry, War, and Market Schemes (1850s-1900s)
As factories and electricity spread, copper became hot property. The chart shows a price jump in the 1860s, driven largely by military demand for use in munitions and equipment during events like the American Civil War. But the late 1800s also saw drama like the Secrétan Syndicate (1887-1889). This French group famously attempted to corner the global copper market, buying up supply to push prices sky-high before it all came crashing down, triggering a major price collapse as detailed in historical analyses of the event.
Turbulent Times: World Wars and Economic Crisis (Early to Mid-20th Century)
The 20th century brought major conflicts and economic storms, all mirrored in copper's price:
- World War I (1914-1918): Demand for copper in shell casings, wiring, and other military equipment sent prices soaring, as seen in the 1916-1918 spike according to U.S. Geological Survey (USGS) reports from the era.
- The Great Depression (1930s): When the world economy collapsed, demand for industrial metals like copper dried up, causing a price collapse to historic lows.
- World War II (1939-1945): War again meant huge copper demand, but this time, governments took direct control. Official markets like the London Metal Exchange were subject to strict regulations, with governments managing the supply and price of strategic metals to support the war effort.
Rebuilding and Electrifying the World (Mid to Late 20th Century)
After WWII, the world started rebuilding and plugging in. The chart highlights this long rise:
- Post-War Boom: From the 1940s onwards, massive reconstruction efforts in Europe and Japan, a growing global economy, and the spread of electricity to homes and industries created a huge, sustained need for copper.
- 1970s Shocks: The oil crises and high inflation of the 1970s, marked on the chart, also pushed copper prices up due to a combination of higher energy production costs and economic uncertainty a phenomenon analyzed in commodity market studies.
China's Rise and a Metals Frenzy (Early 21st Century)
A new era for copper began when China joined the World Trade Organization (WTO) in 2001:
- The "Commodity Supercycle": China's incredible growth into a manufacturing and construction powerhouse created an unprecedented appetite for all industrial metals. This demand fueled a massive surge in commodity prices that became known as the "supercycle," including a dramatic climb for copper as documented by institutions like the Bank of Canada.
The Green Push: Copper's New Demand (2020s Onwards)
Today, another major shift is boosting copper:
- Energy Transition: From 2020 onwards, the global move to green energy requires vast amounts of copper. Electric cars, solar panels, wind turbines, and the expansion of electricity grids are creating a new wave of structural demand. According to the International Energy Agency (IEA), this "green demand" is a powerful force that is expected to continue pushing on supply.
Copper: A Sign of the Times
Copper's price story over the last 175 years truly reflects world history – from wars and economic crises to technological leaps and our changing priorities. As we build a more electric and sustainable future, copper remains a key ingredient, and its price will continue to tell an important tale.
Disclaimer
The information and data presented in this article and accompanying infographic are for informational and educational purposes only and should not be considered financial or investment advice. While we strive to present accurate and timely information from sources believed to be reliable, MiningVisuals makes no representations or warranties of any kind, express or implied, about the completeness, accuracy, or reliability of the content. Historical market performance is not indicative of future results. Readers are strongly encouraged to conduct their own research and consult with a qualified financial advisor before making any investment decisions.
General Sources:
Source: macrotrends, Cochilco data, USGS




Explore More
View All


The World’s Largest Operating Copper Mines Alongside Reko Diq
The World’s Largest Operating Copper Mines Alongside Reko Diq
Ten operating mines in six countries each produced between 359,000 and 1.32 million tonnes of copper in 2025, according to Wood Mackenzie estimates. Reko Diq in Pakistan appears alongside them with a figure from Barrick’s feasibility study, which refers to planned future production. More than half of the ten mines’ combined output came from the five in South America. The 2025 figures also reflect a disrupted year at Grasberg in Indonesia, while Reko Diq’s number points to a project planned in two phases.
Most Major Copper Discoveries Since 1990 Are Still Not Mines.
Most Major Copper Discoveries Since 1990 Are Still Not Mines.
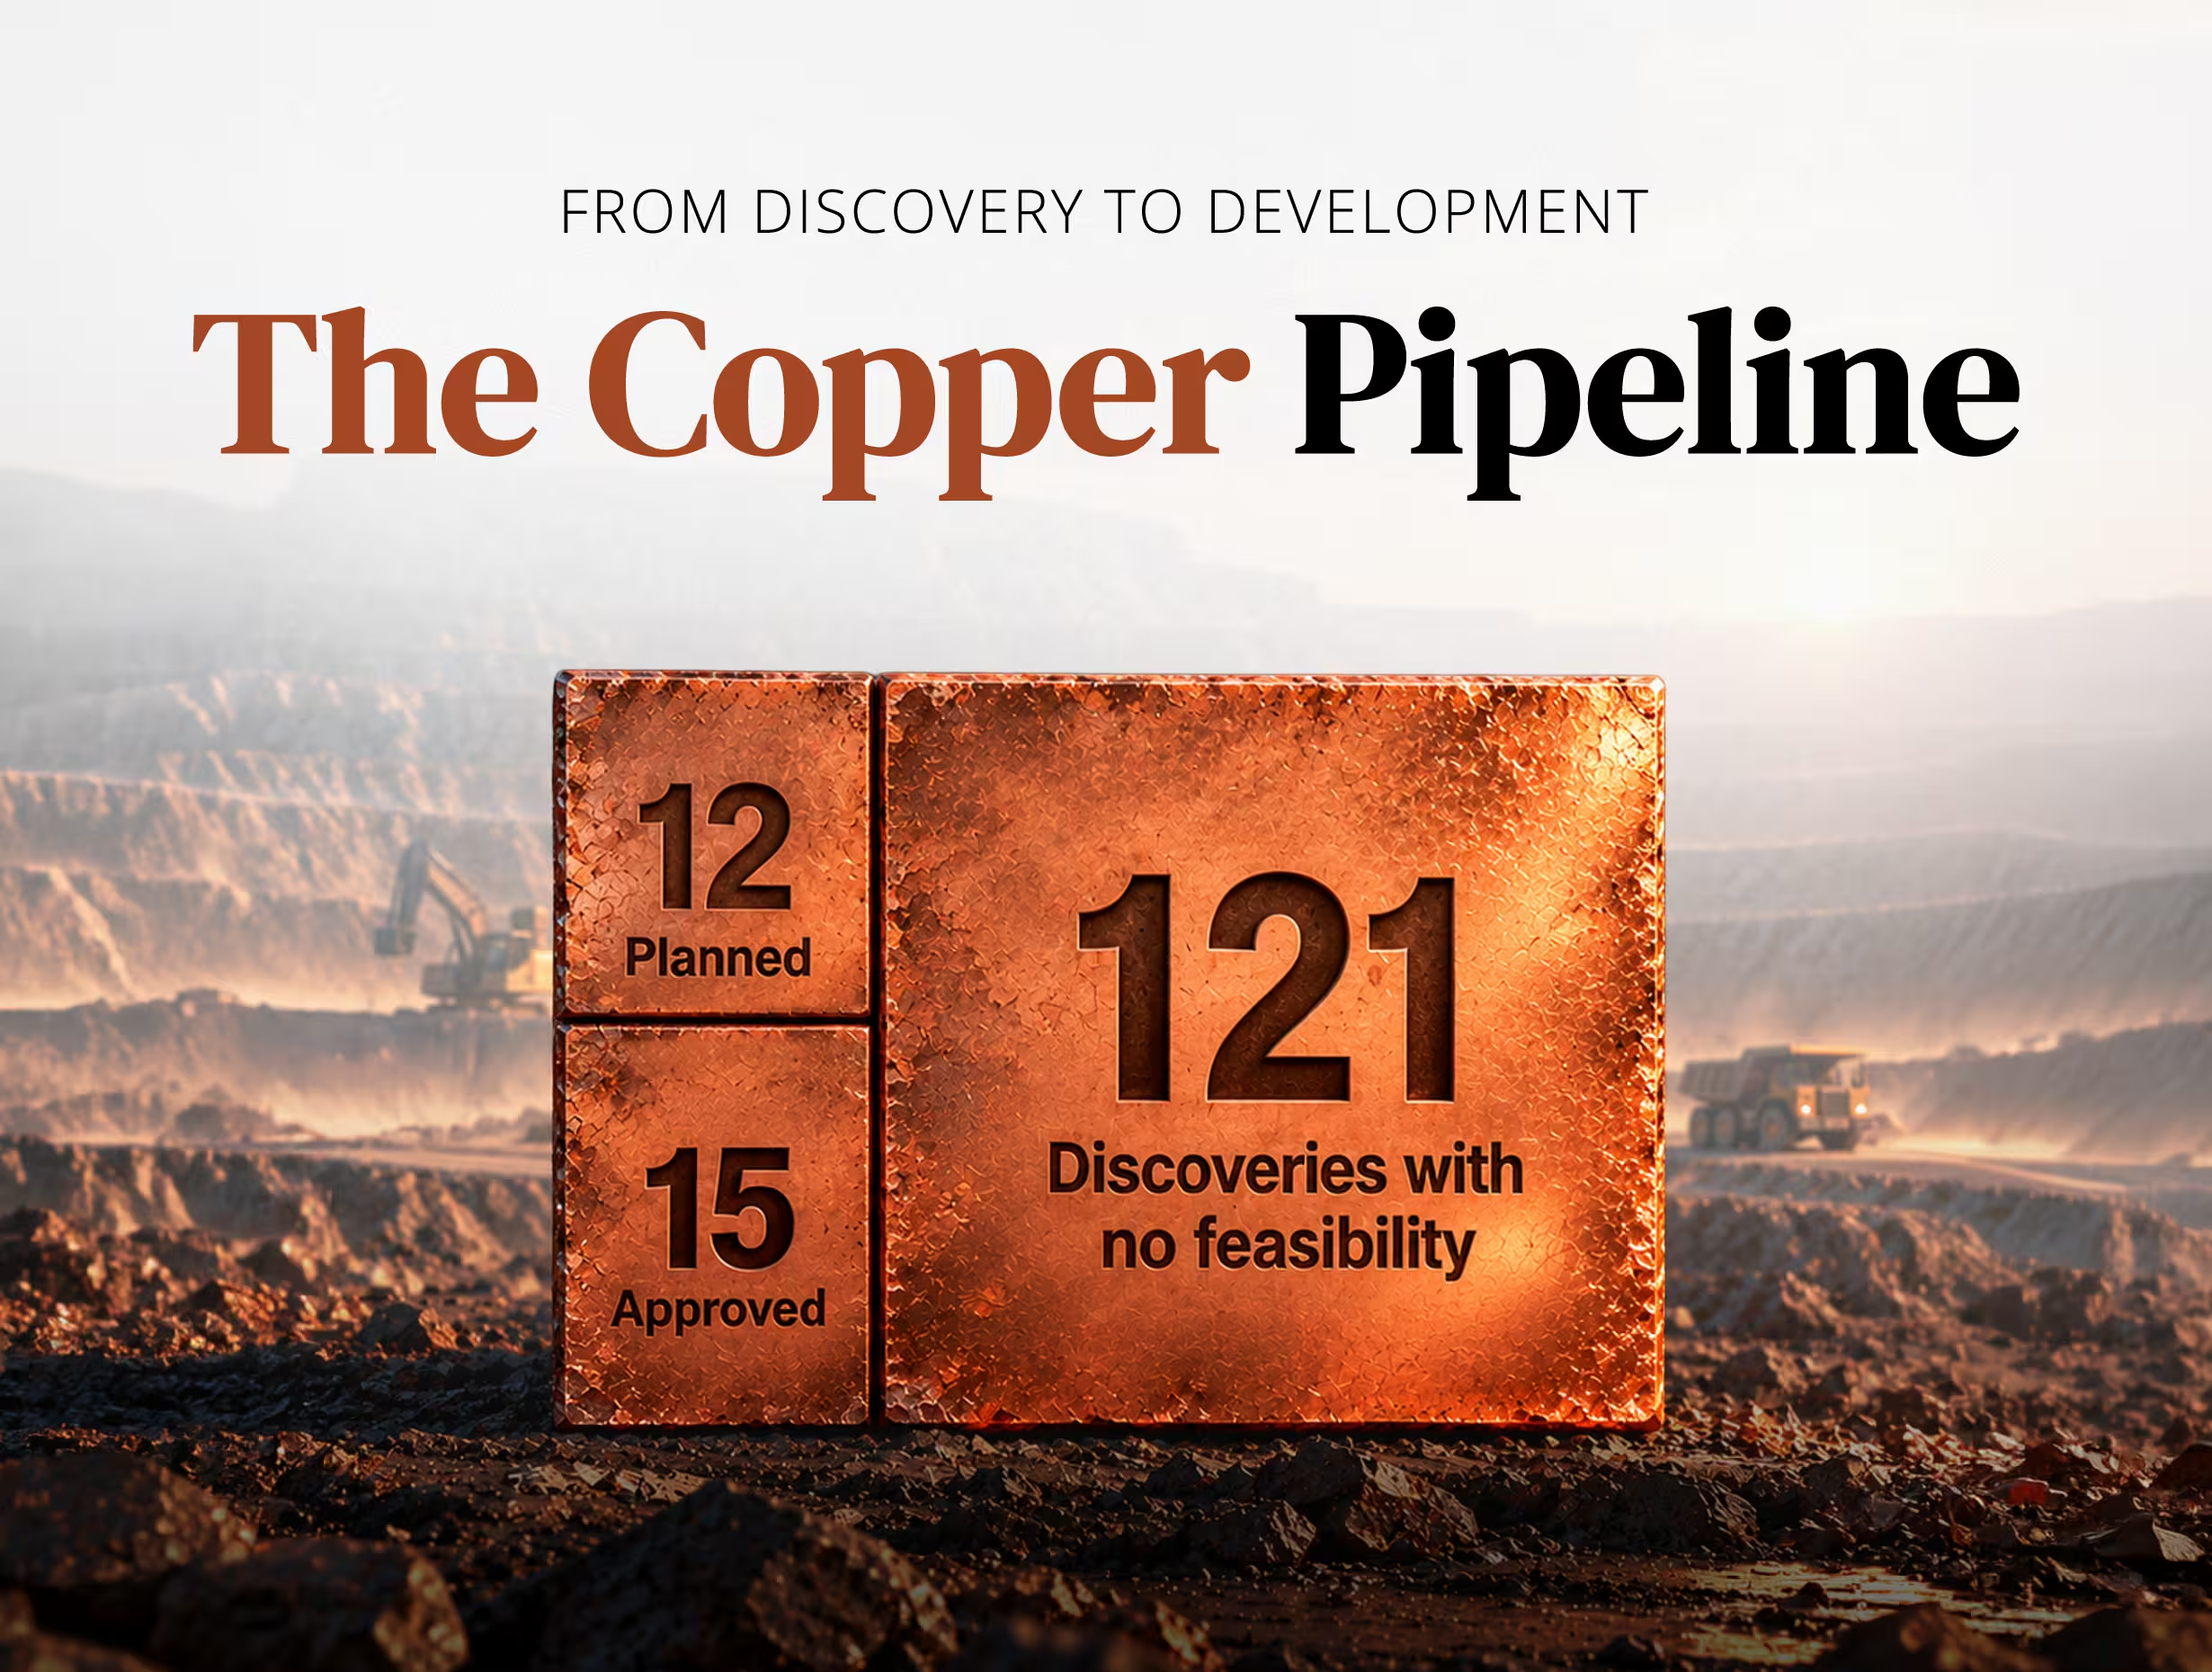
In May 2025, a joint venture of Lundin Mining and BHP released a resource estimate for its Vicuña district in the Andes, which S&P Global ranked as home to the largest greenfield copper discovery in 30 years. Per the same resource statement, the combined Filo del Sol and Josemaria deposits hold 13 million tonnes of contained copper in measured and indicated resources.
China Holds 56% of the Capacity at the World's 21 Largest Copper Refineries
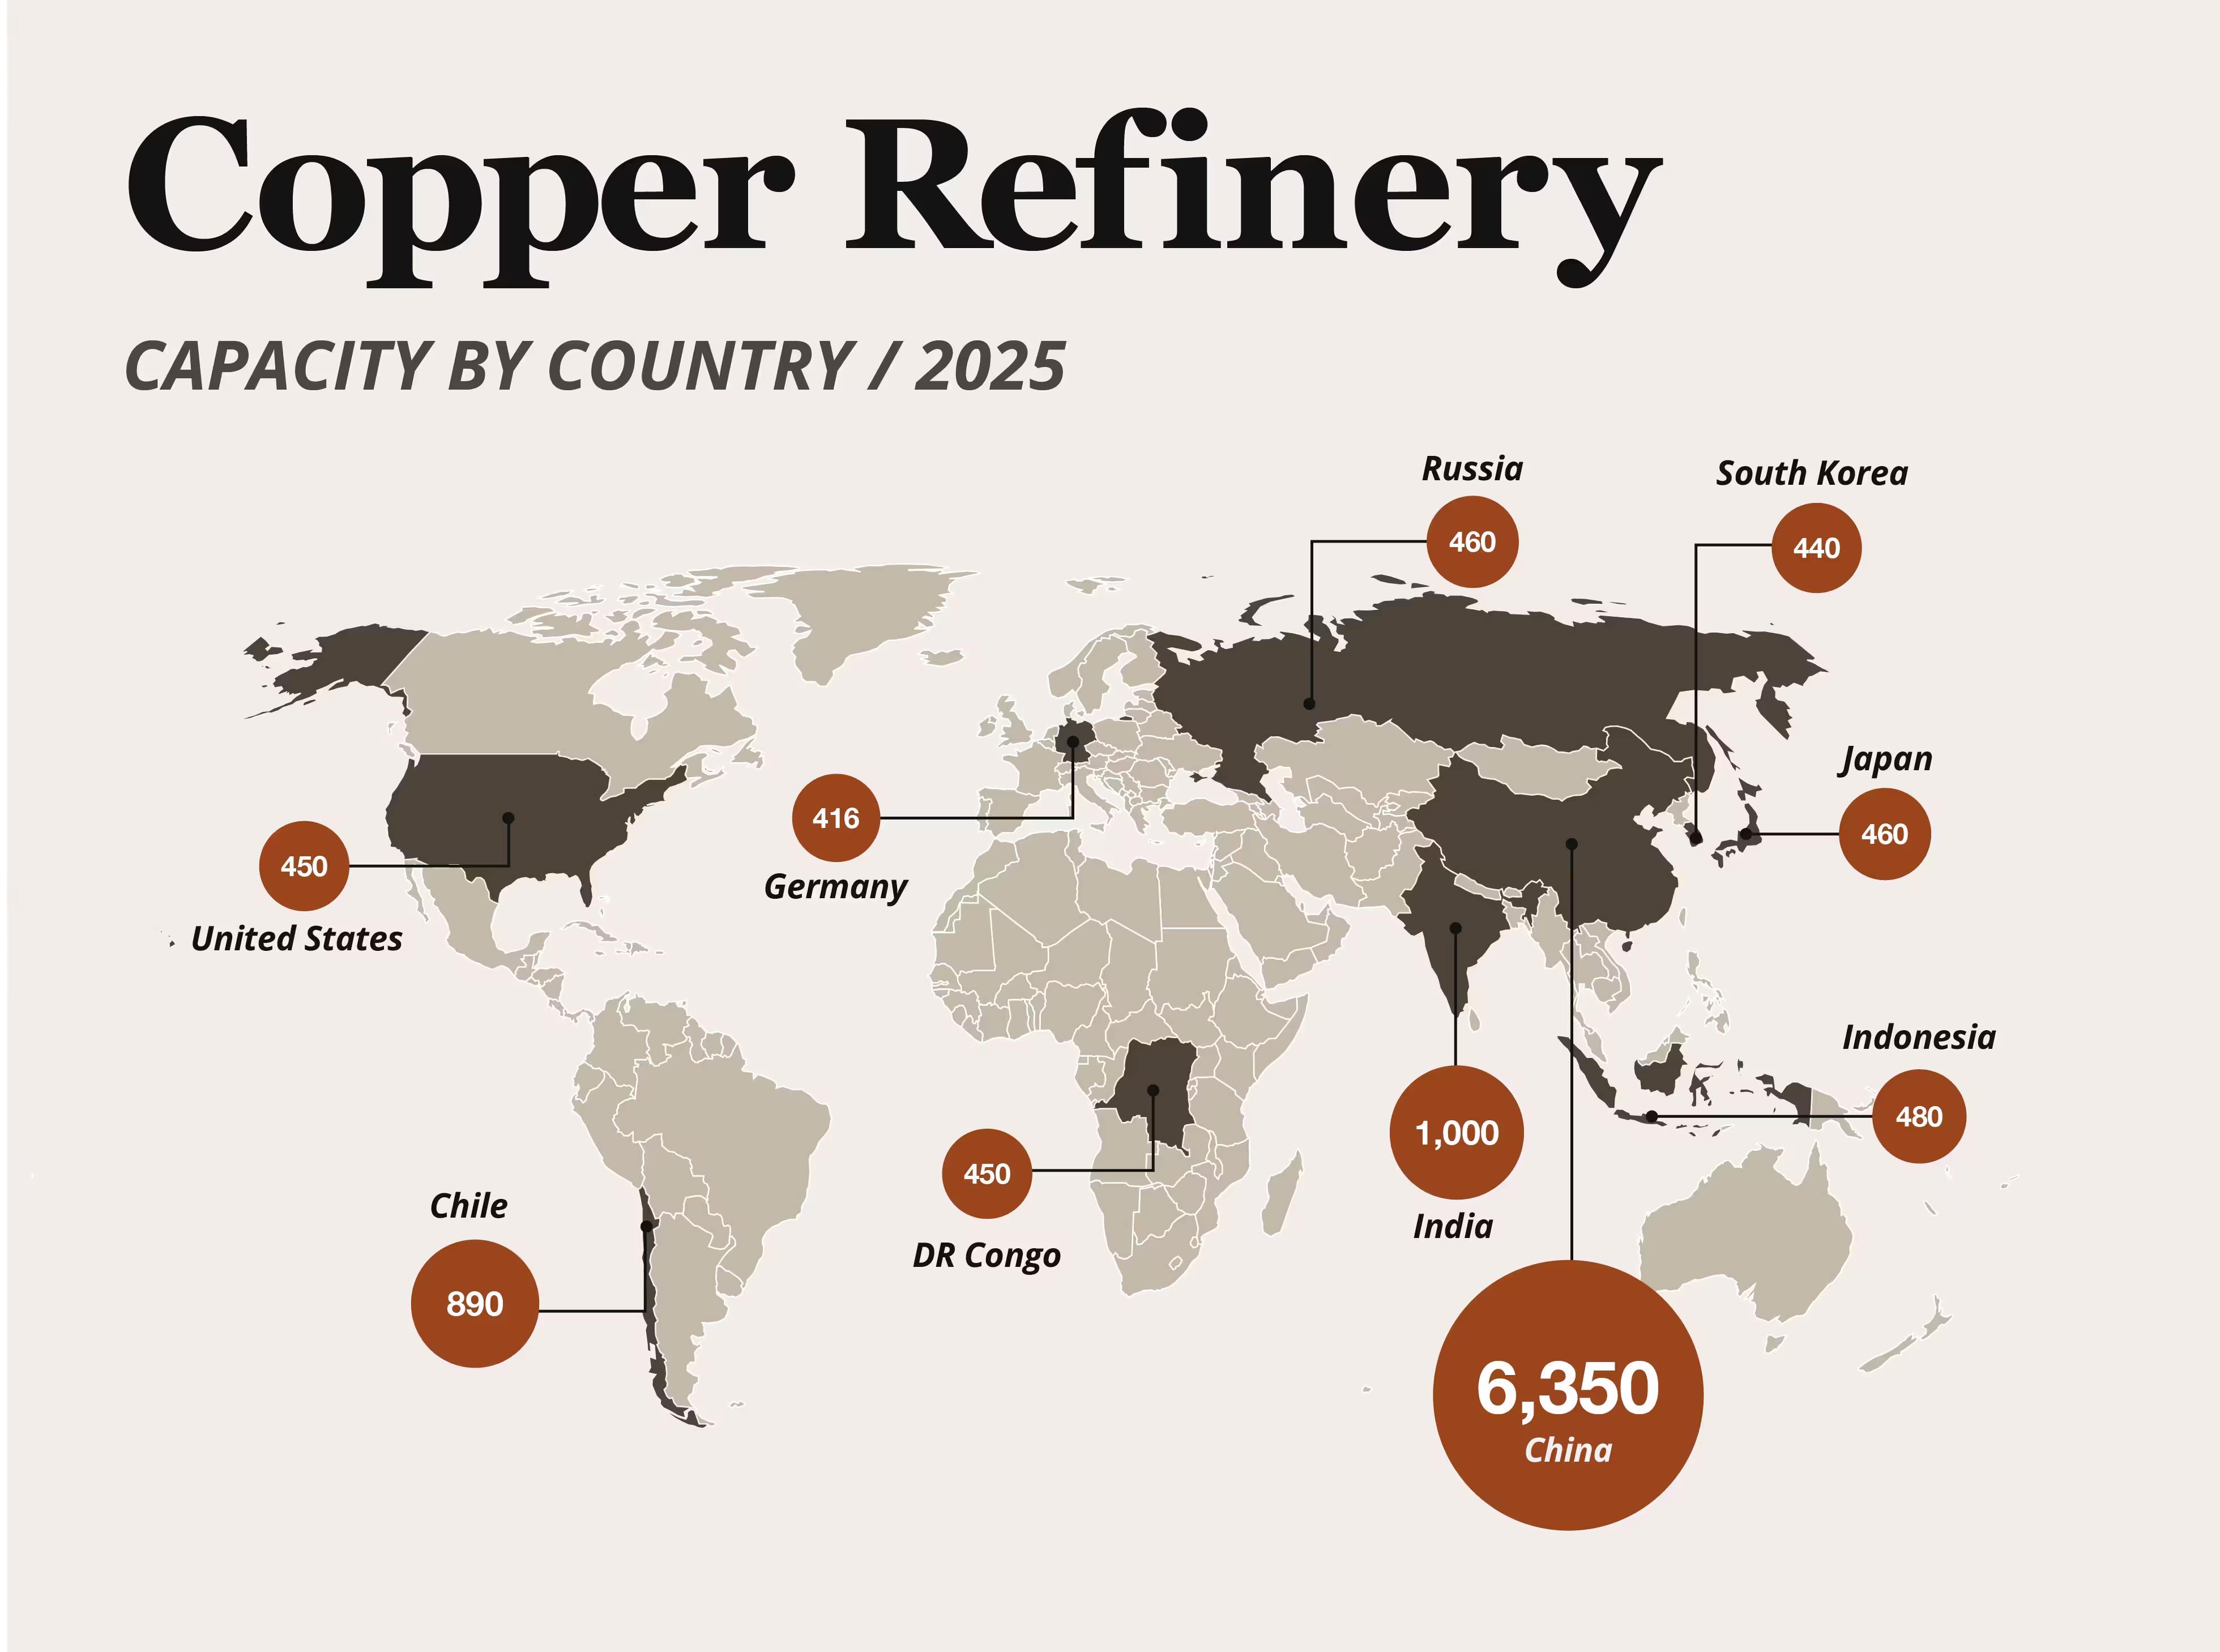
China Holds 56% of the Capacity at the World's 21 Largest Copper Refineries
Indonesia's circle on the map above stands for a single plant: the Manyar refinery in East Java, operated by PT Freeport Indonesia, with 480,000 tonnes a year of capacity, according to the International Copper Study Group. It has been shut since the fourth quarter of 2025, after a mudflow at the Grasberg mine cut off its concentrate supply, and is due to restart this month at below 30% of capacity.
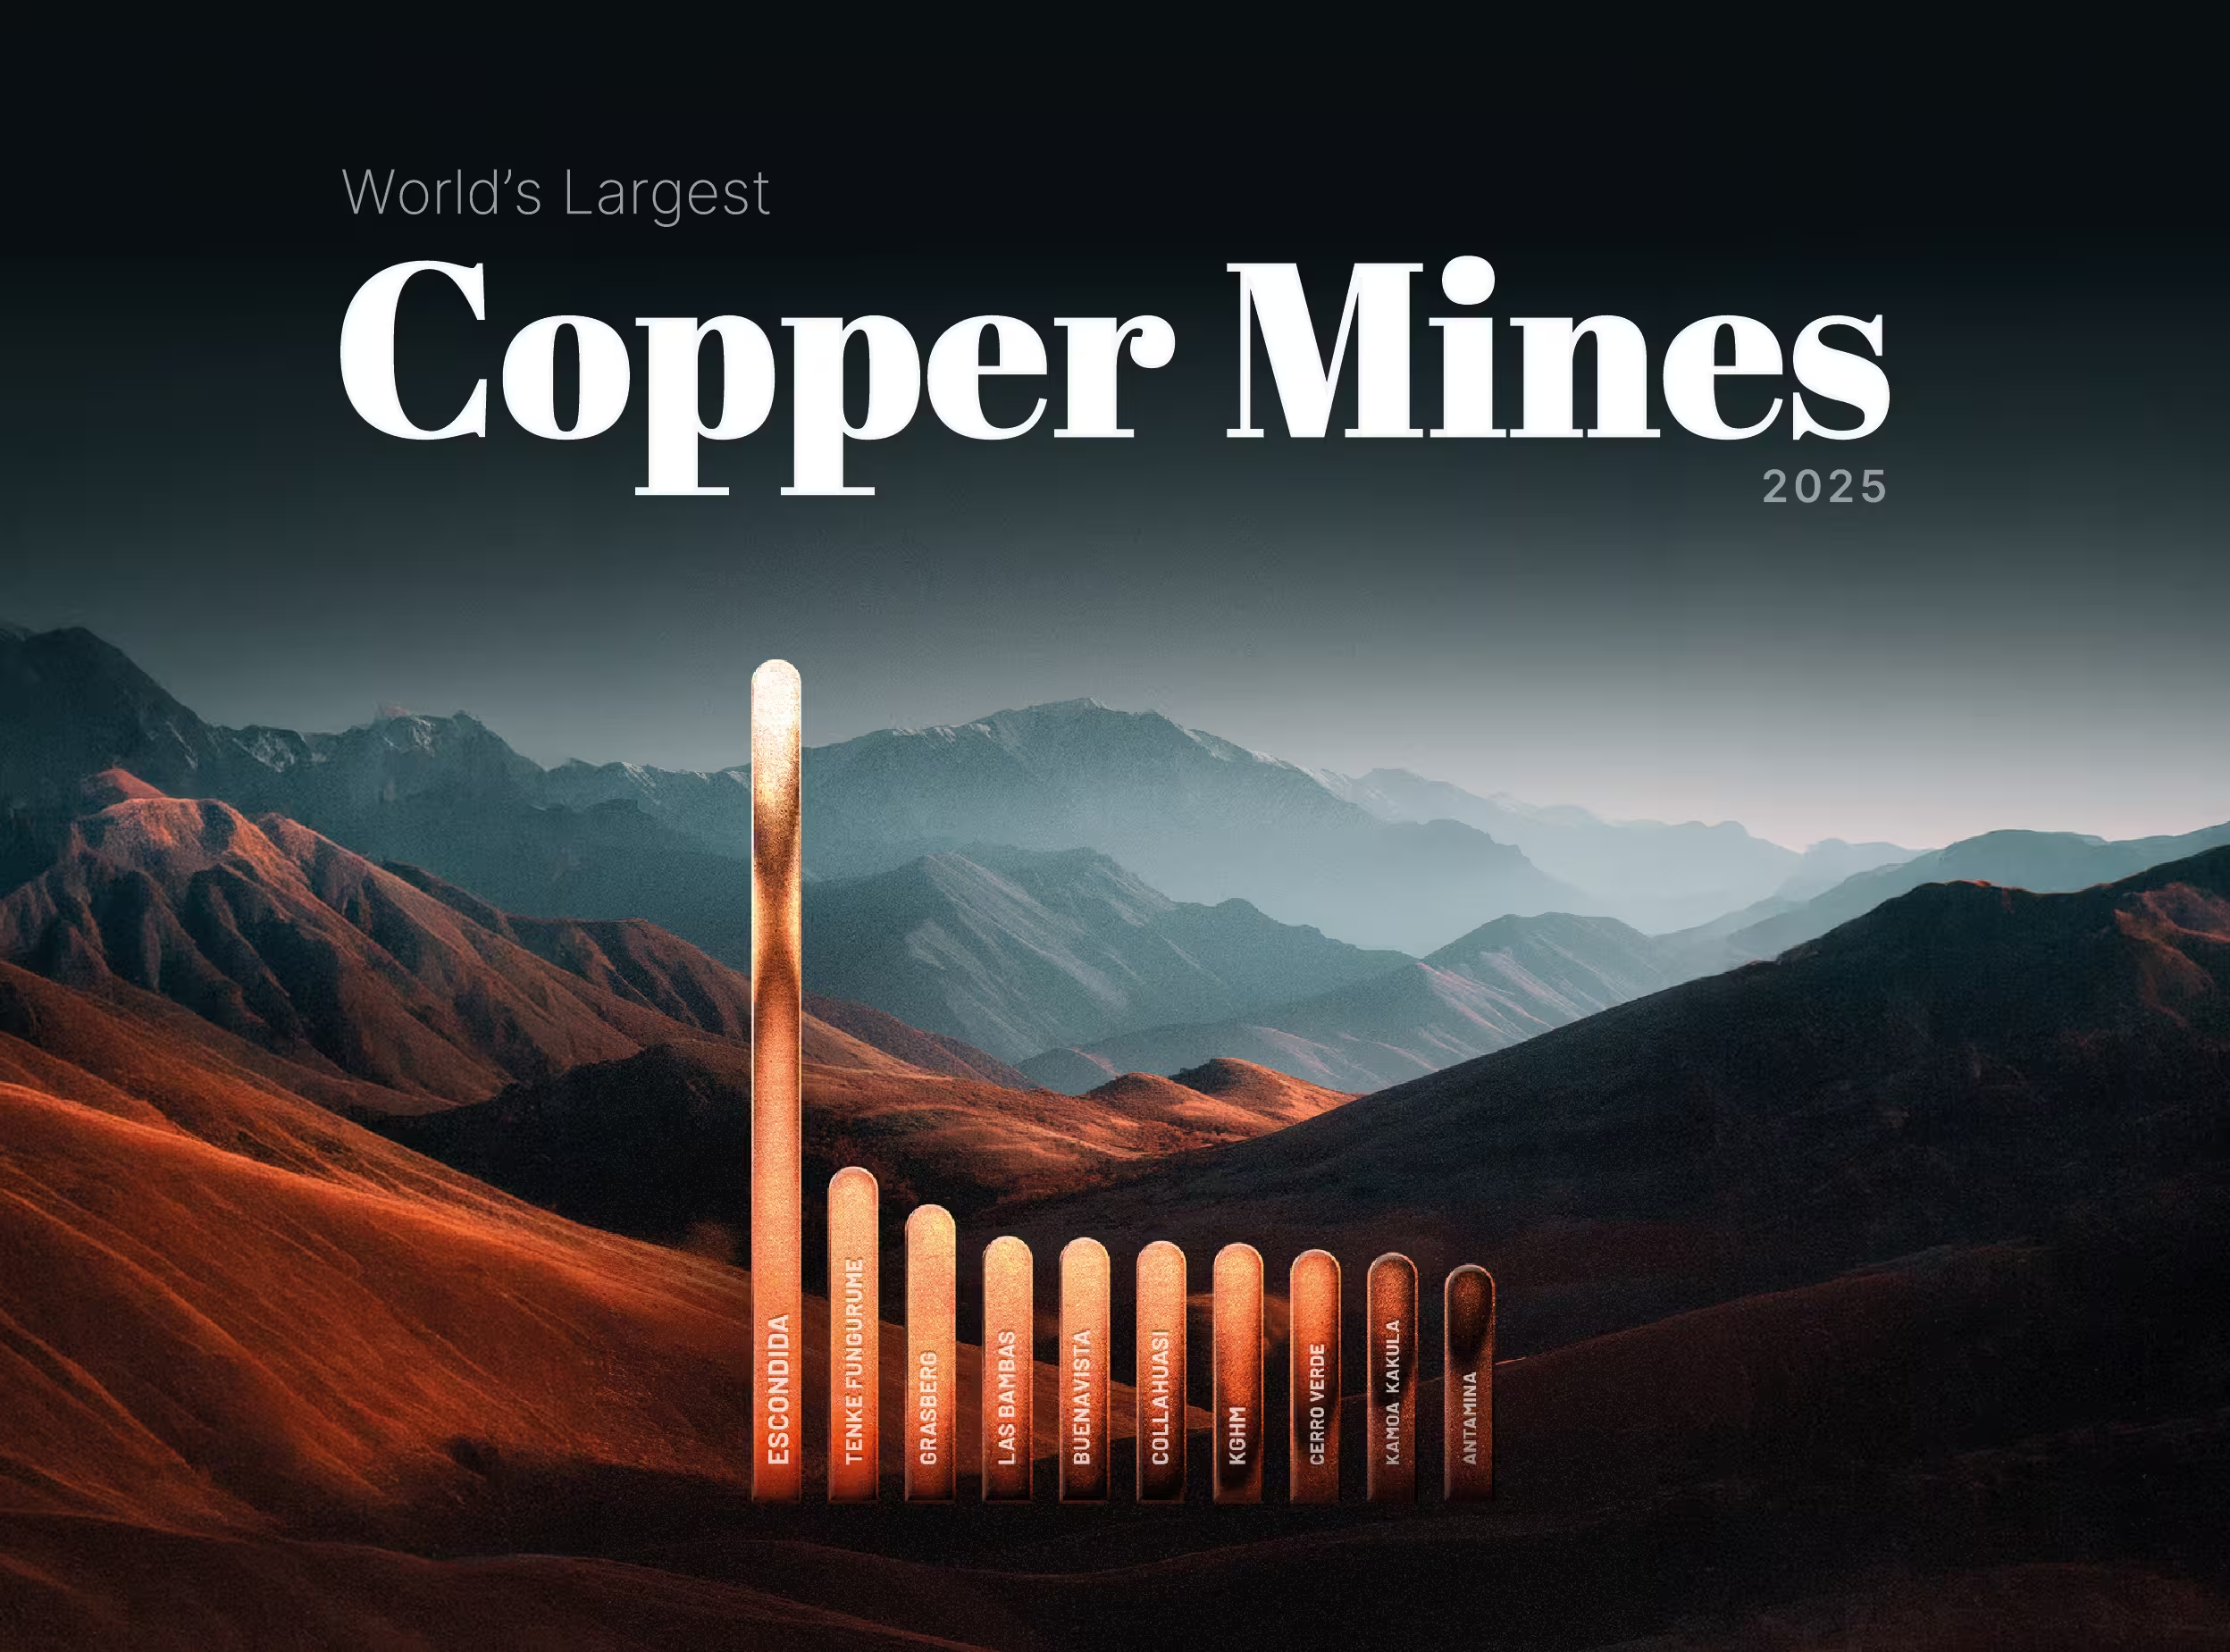
Ranked: The World's Largest Copper Mines (2025)
Ranked: The World's Largest Copper Mines (2025)
Copper has spent 2026 setting records, touching an intraday COMEX high of $6.71 per pound on May 13 amid AI-driven demand and supply shocks, against a backdrop where the ICSG now forecasts a 150,000-tonne deficit for 2026. In a market this tight, where the deficit thesis turns on lost tonnes, the question of where the world's copper actually comes from carries unusual weight.