Precious Metals
July 7, 2025
3 min
Precious Metals

For market observers who follow precious metals, the Gold/Silver Ratio is a frequently cited metric. While it provides a simple snapshot of relative value, a deeper analysis of its history reveals a recurring pattern: significant upward movements in the price of silver have often followed periods where the Gold/Silver Ratio reached a peak.
This article explores several of these historical instances as detailed in the accompanying infographic, based entirely on past market data.
Historical Case Studies: Ratio Peaks and Silver Price Moves
The infographic highlights key periods over the past 25 years where peaks in the gold-to-silver ratio have historically preceded or coincided with significant upswings in the price of silver.
- The Post-Dot Com Recovery Period (2003-2008): Following a peak in the ratio, the price of silver began a multi-year ascent, marking a +340% gain from its low to the 2008 high point shown.
- The Post-Crisis Recovery (2008-2011): After the ratio peaked again during the 2008 financial crisis, the subsequent period saw silver rise substantially, gaining +391% into its 2011 peak.
- Mid-Cycle Consolidation (2016-2018): During this period, the Gold/Silver Ratio reached a notable peak in 2016, coinciding with the start of a significant upswing in the price of silver. From its low in that upswing, silver posted a +47% gain.
- The COVID-19 Pandemic Period (2020-2021): The ratio's climb to a modern record high was followed by a sharp increase in silver's price, with a +104% gain highlighted.
- Gradual Ascent Amid Rate Hikes (2022-Today): The most recent period has also seen a +102% (as of July 1 2025) upswing in silver from its 2022 low, following the preceding period of a high Gold/Silver Ratio.
The Central Observation
The key takeaway from 25 years of data is the clear historical correlation shown on the chart: each major peak in the Gold/Silver Ratio during this period has corresponded with the start of a significant upswing in the price of silver.
It is important to state that this is a historical observation of past performance and not an indication or suggestion that this pattern will repeat. The dynamics behind this recurring pattern are partly rooted in silver's dual nature as both a monetary and industrial metal, as well as the relative size of its market compared to gold.
The current ratio of 92 (July 1, 2025) is approximately 40% above its 25-year historical average, placing it at an elevated level from a historical standpoint.
Sponsored by:

Outcrop Silver is a leading explorer and developer focused on advancing its flagship Santa Ana high-grade silver project in Colombia. Leveraging a disciplined and seasoned team of professionals with decades of experience in the region. Outcrop Silver is dedicated to expanding current mineral resources through strategic exploration initiatives.
At the core of our operations is a commitment to responsible mining practices and community engagement, underscoring our approach to sustainable development. Our expertise in navigating complex geological and market conditions enables us to consistently identify and capitalize on opportunities to enhance shareholder value.
With a deep understanding of the Colombian mining landscape and a track record of successful exploration, Outcrop Silver is poised to transform the Santa Ana project into a significant silver producer, contributing positively to the local economy and setting new standards in the mining industry.
Learn more about Outcrop Silver at https://outcropsilver.com/
Disclaimer and Data Source: The content of this article is for informational and educational purposes only and should not be construed as investment advice or a recommendation to buy or sell any precious metals or securities. The information provided is based on historical data and analysis; past performance is not indicative of future results. While we strive for accuracy, we cannot guarantee the completeness or accuracy of the information presented. The data and charts presented in the accompanying infographic are sourced from TradingView.


Explore More
View All
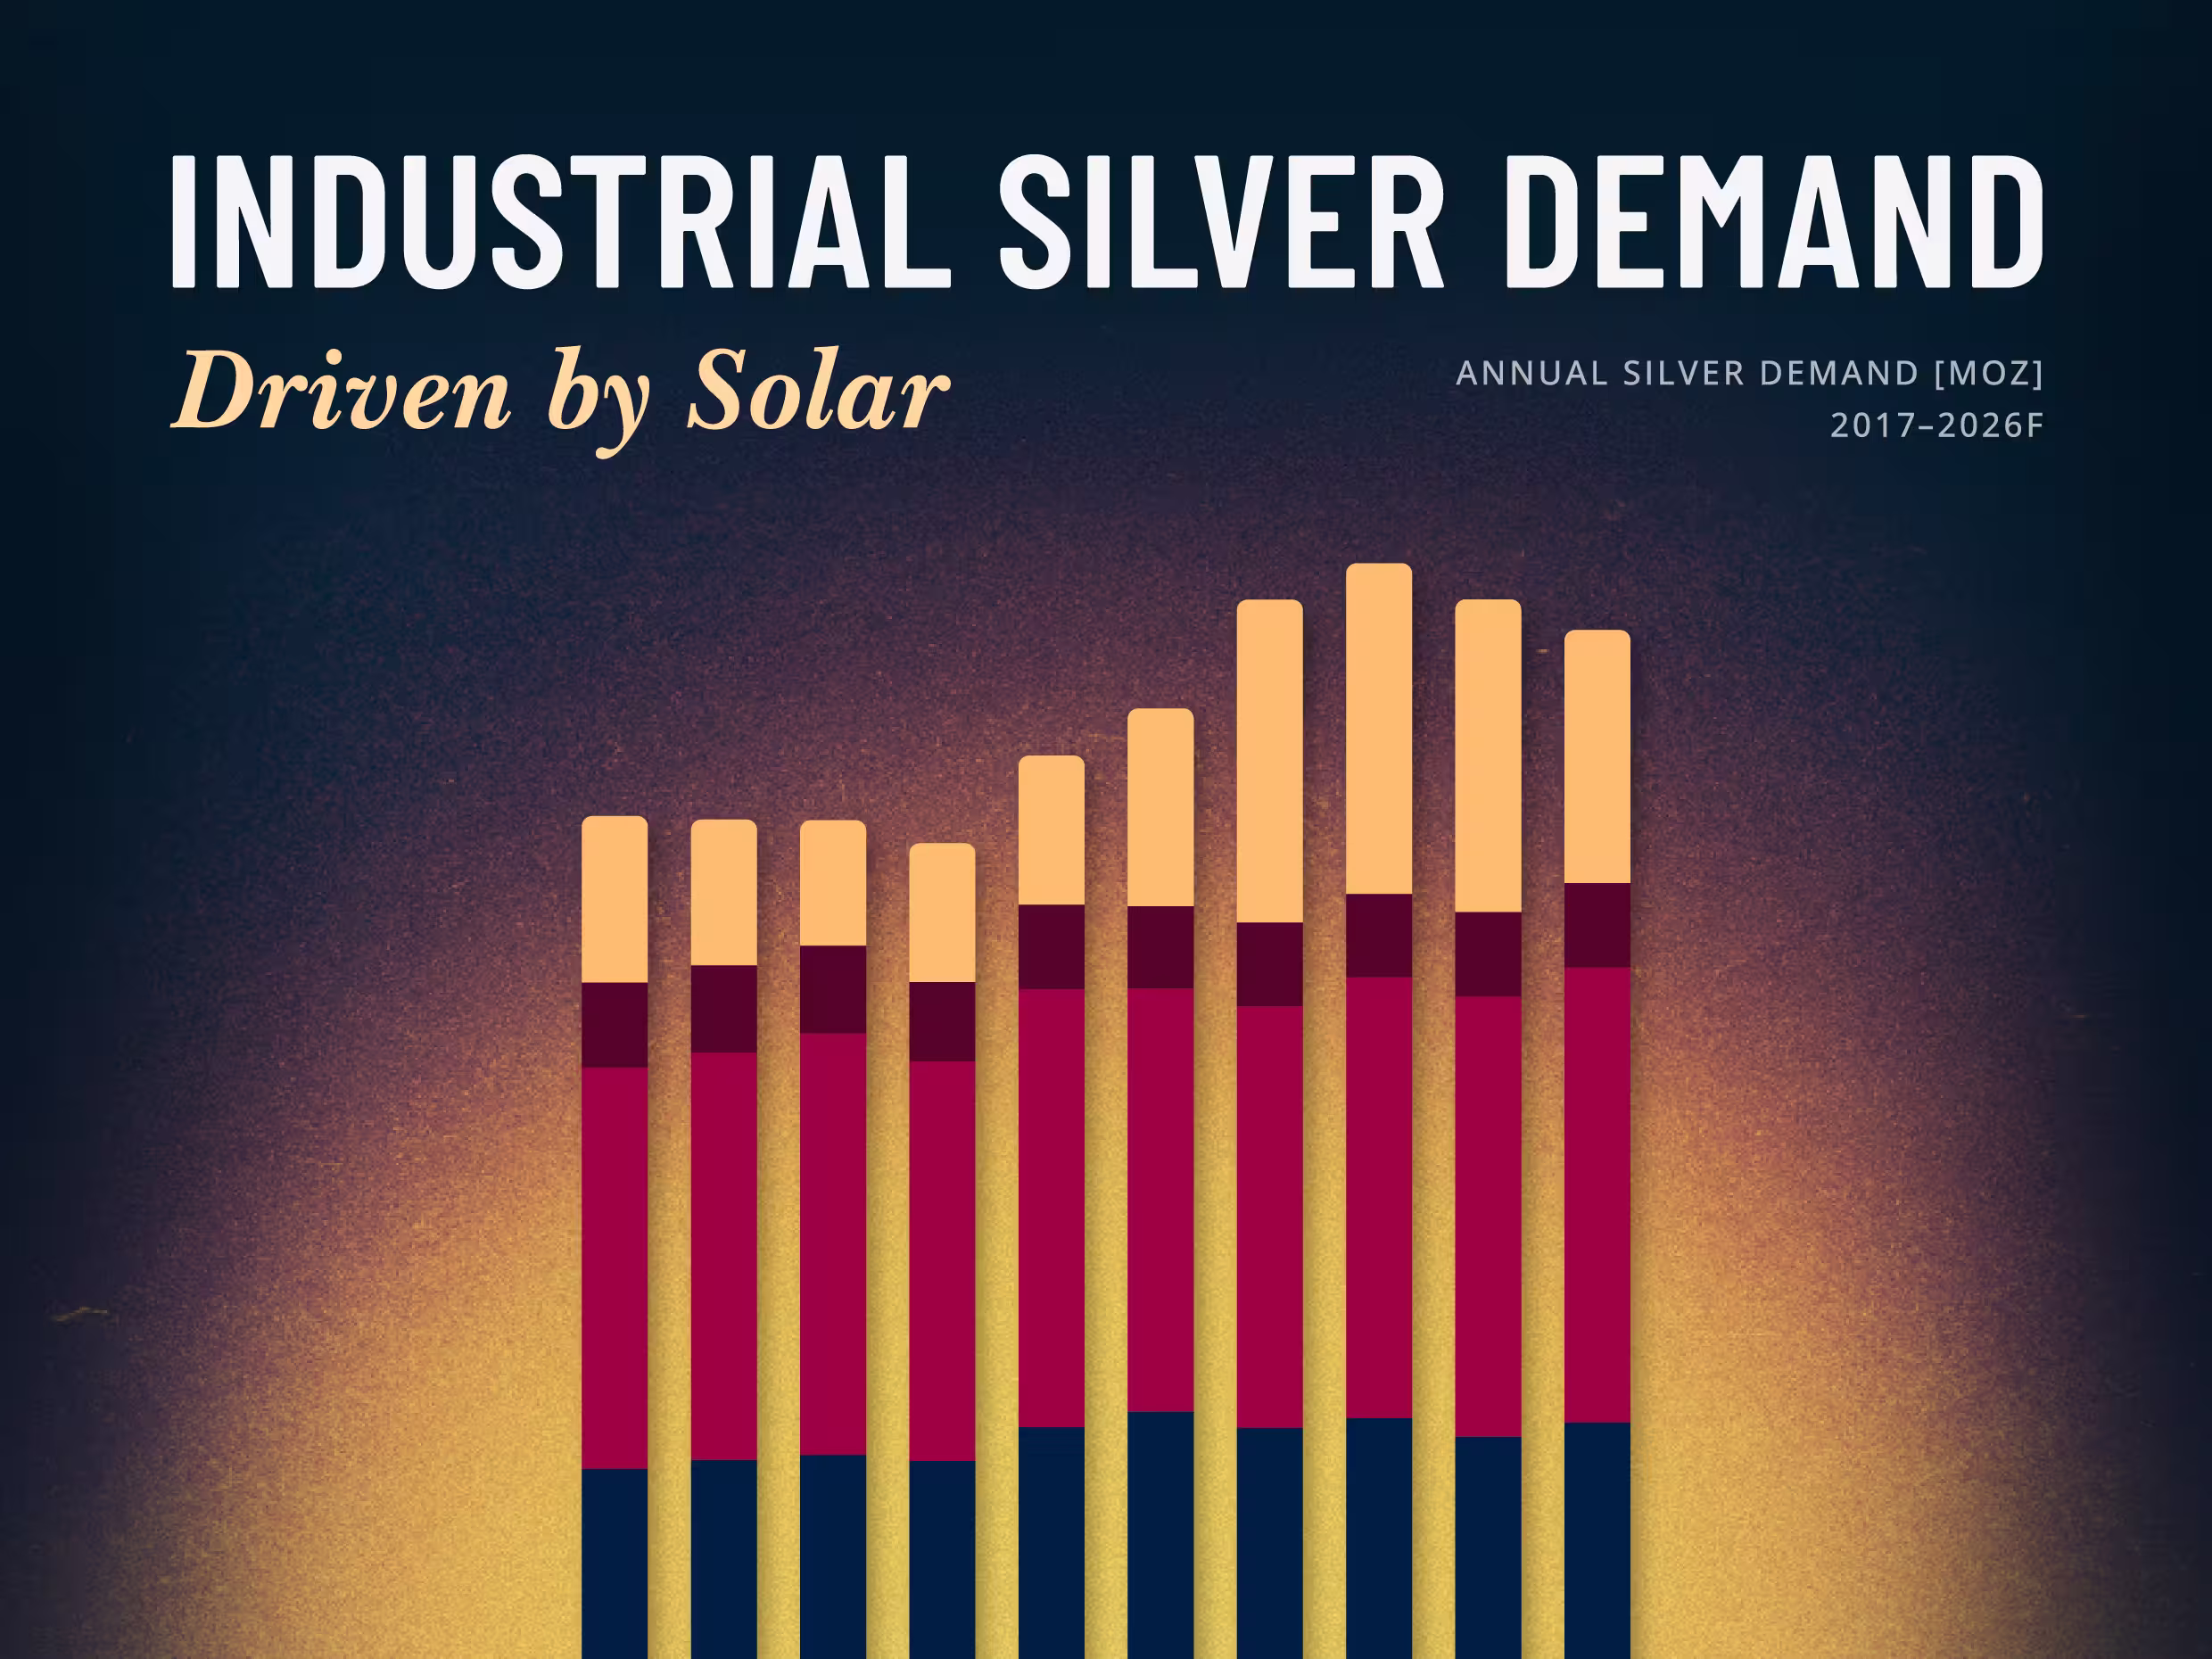
Solar Is Silver's Largest Industrial Market, and Not Easily Replaced
Solar Is Silver's Largest Industrial Market, and Not Easily Replaced
When LONGi Green Energy, the world's largest solar module maker, told investors on January 5, 2026 that it would begin mass-producing base-metal solar cells in the second quarter, it put a number on a pressure the whole industry feels. Solar is the largest single application within silver's industrial demand, and as the metal ran to a record above $121 an ounce in January, rising silver costs pushed manufacturers to accelerate efforts to reduce the metal per cell.

Silver in the Data Center: How AI's Power Crunch Is Building a New Pillar of Industrial Demand
Silver in the Data Center: How AI's Power Crunch Is Building a New Pillar of Industrial Demand
In early 2026, the artificial intelligence narrative shifted abruptly from software capabilities to physical hardware constraints. With tech giants committing hundreds of billions to new infrastructure—pushing global hyperscaler capital expenditures past $600 billion this year—the industry has collided with a new primary bottleneck: a severe power and thermal crunch.

Silver's Use Cases: A Visual Guide to Where the Metal Actually Goes
Silver's Use Cases: A Visual Guide to Where the Metal Actually Goes
Somewhere inside a pressurized-water reactor, an alloy that is four-fifths silver is absorbing neutrons to keep the core in check, a job most silver investors have never heard of. It is a useful reminder that the metal people picture as coins and jewelry mostly works elsewhere, across industry.
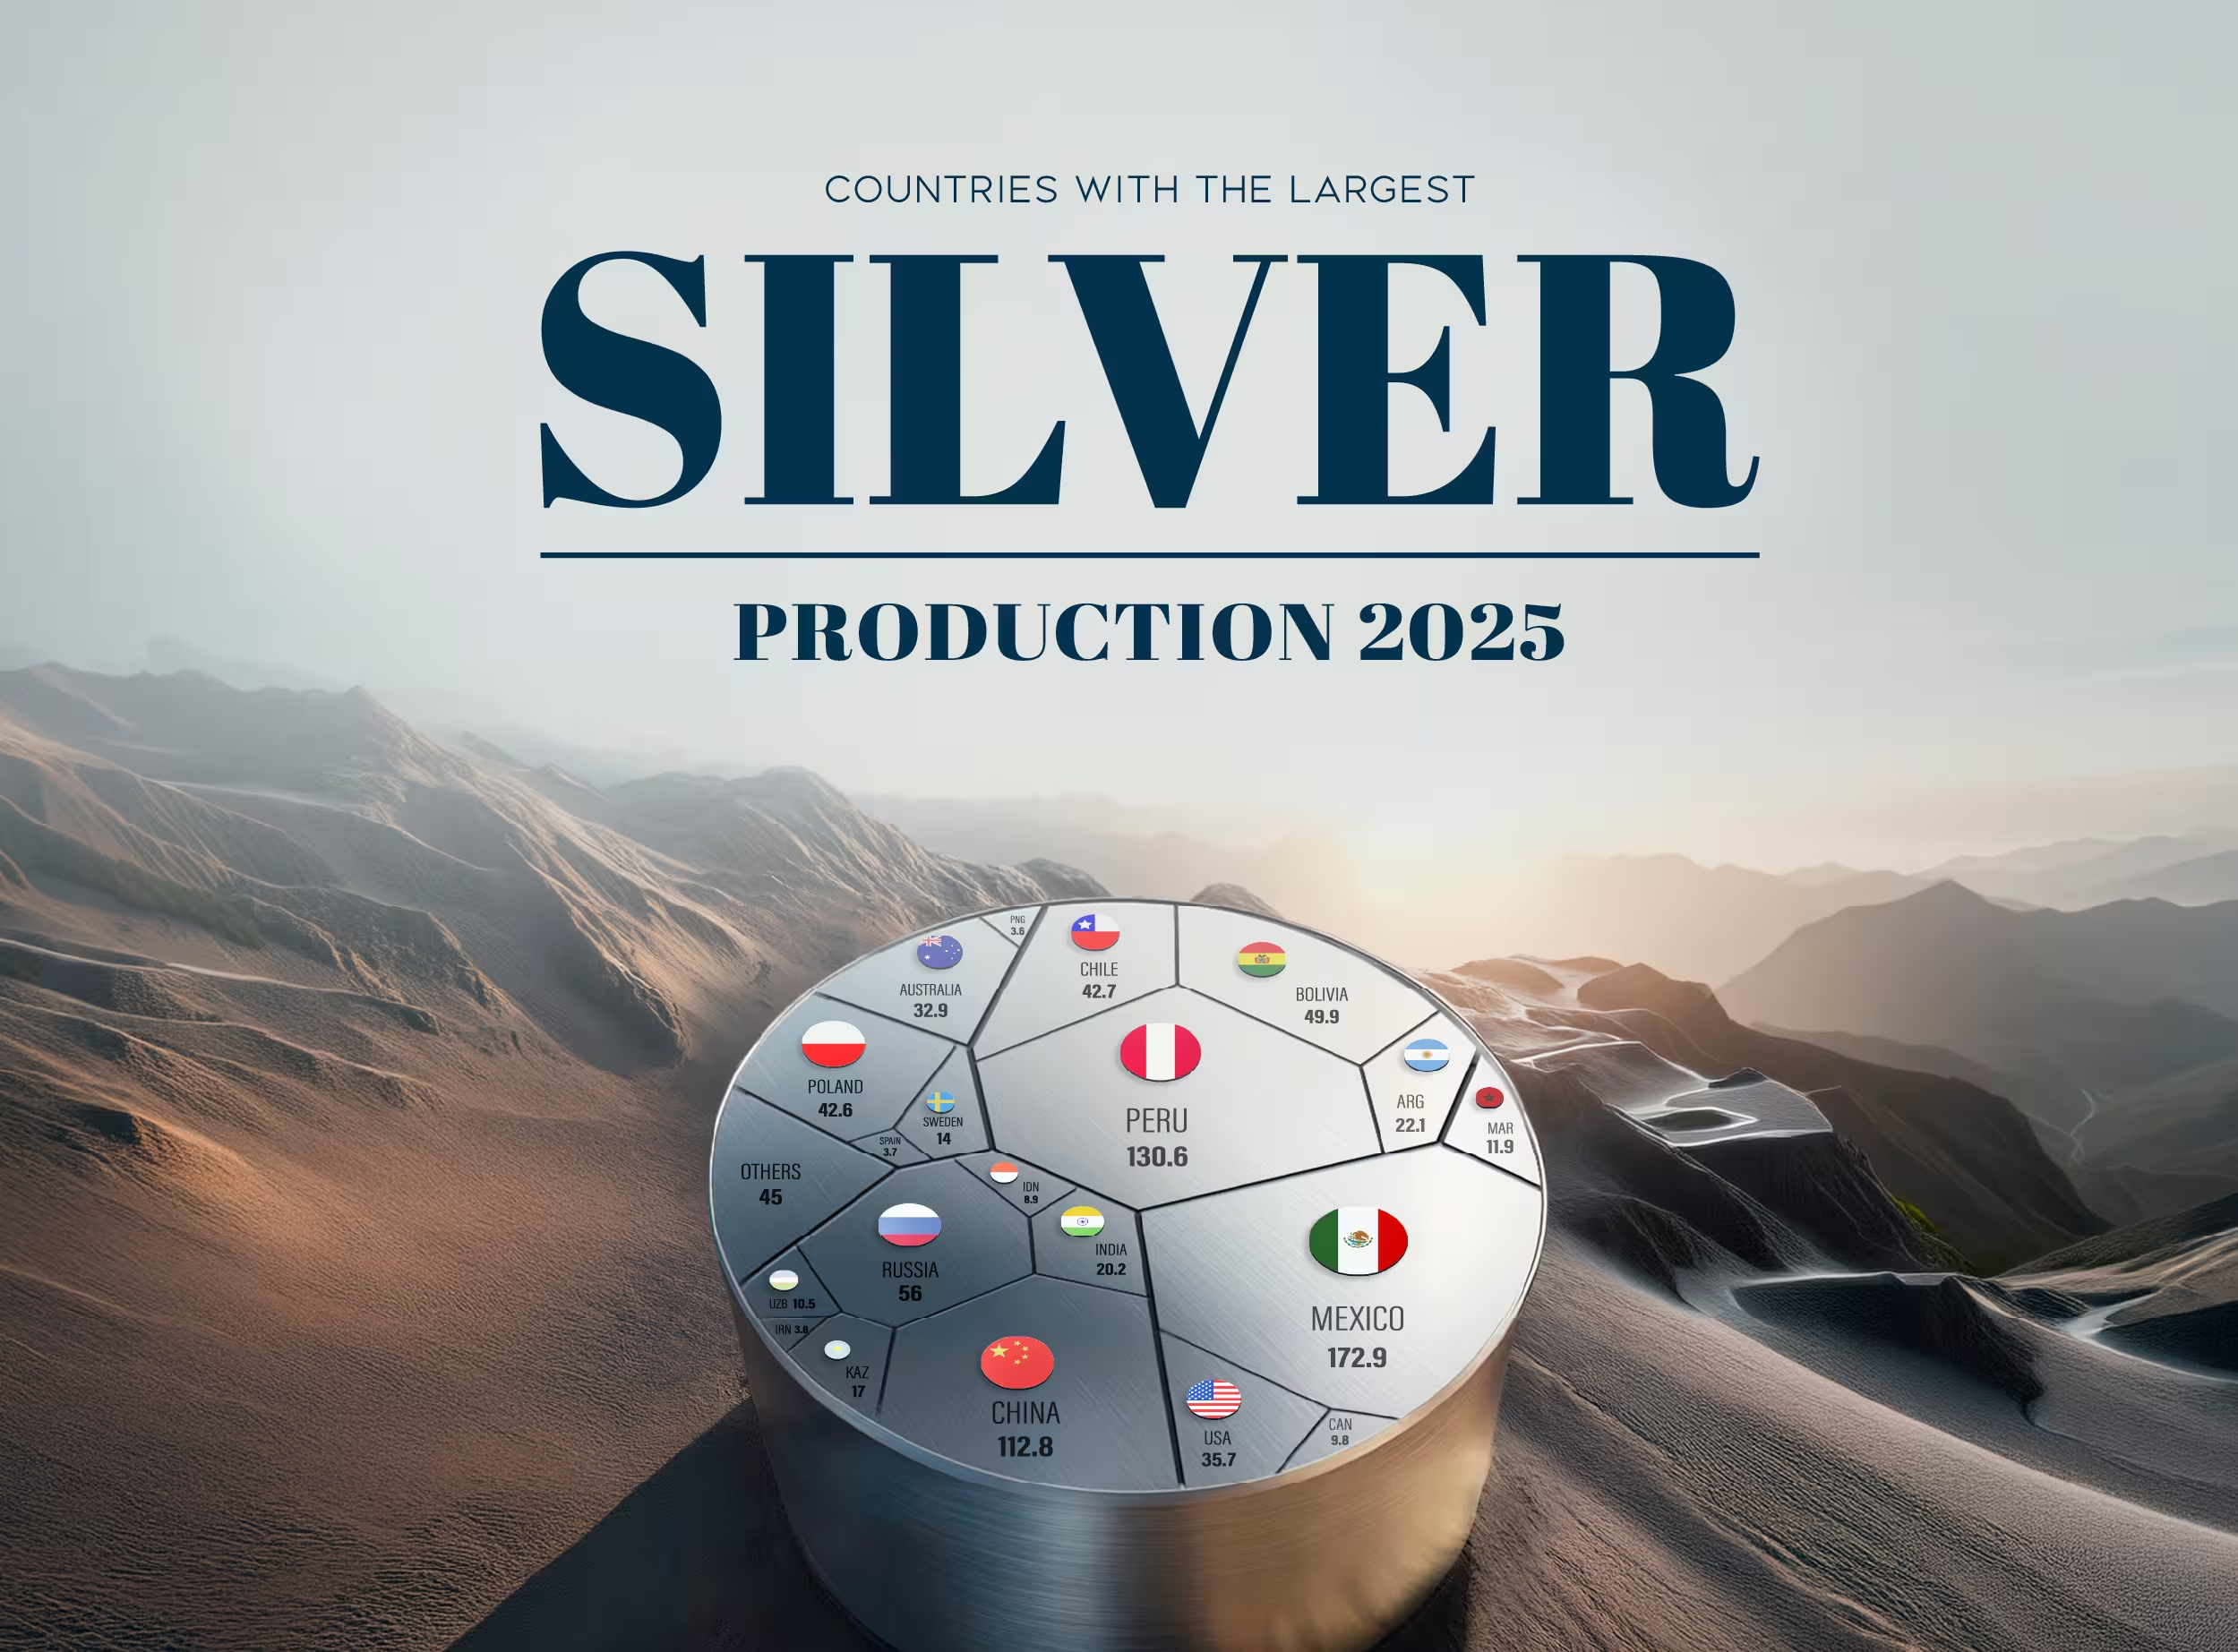
Ranked: The Countries That Produced the Most Silver in 2025
Ranked: The Countries That Produced the Most Silver in 2025
Mexico remained the world's top silver-producing country in 2025, mining 172.9 million ounces (Moz), roughly a fifth of global supply, according to the World Silver Survey 2026, produced for the Silver Institute by Metals Focus. But Mexico's lead narrowed: its output fell 5% for a third straight year, while second-place Peru climbed 7%. Global mine production rose 3% to 846.6 Moz, even as the ranking's top tier told a story of one leader sliding and its closest rival closing in.