Precious Metals
January 7, 2026
4 min
Precious Metals
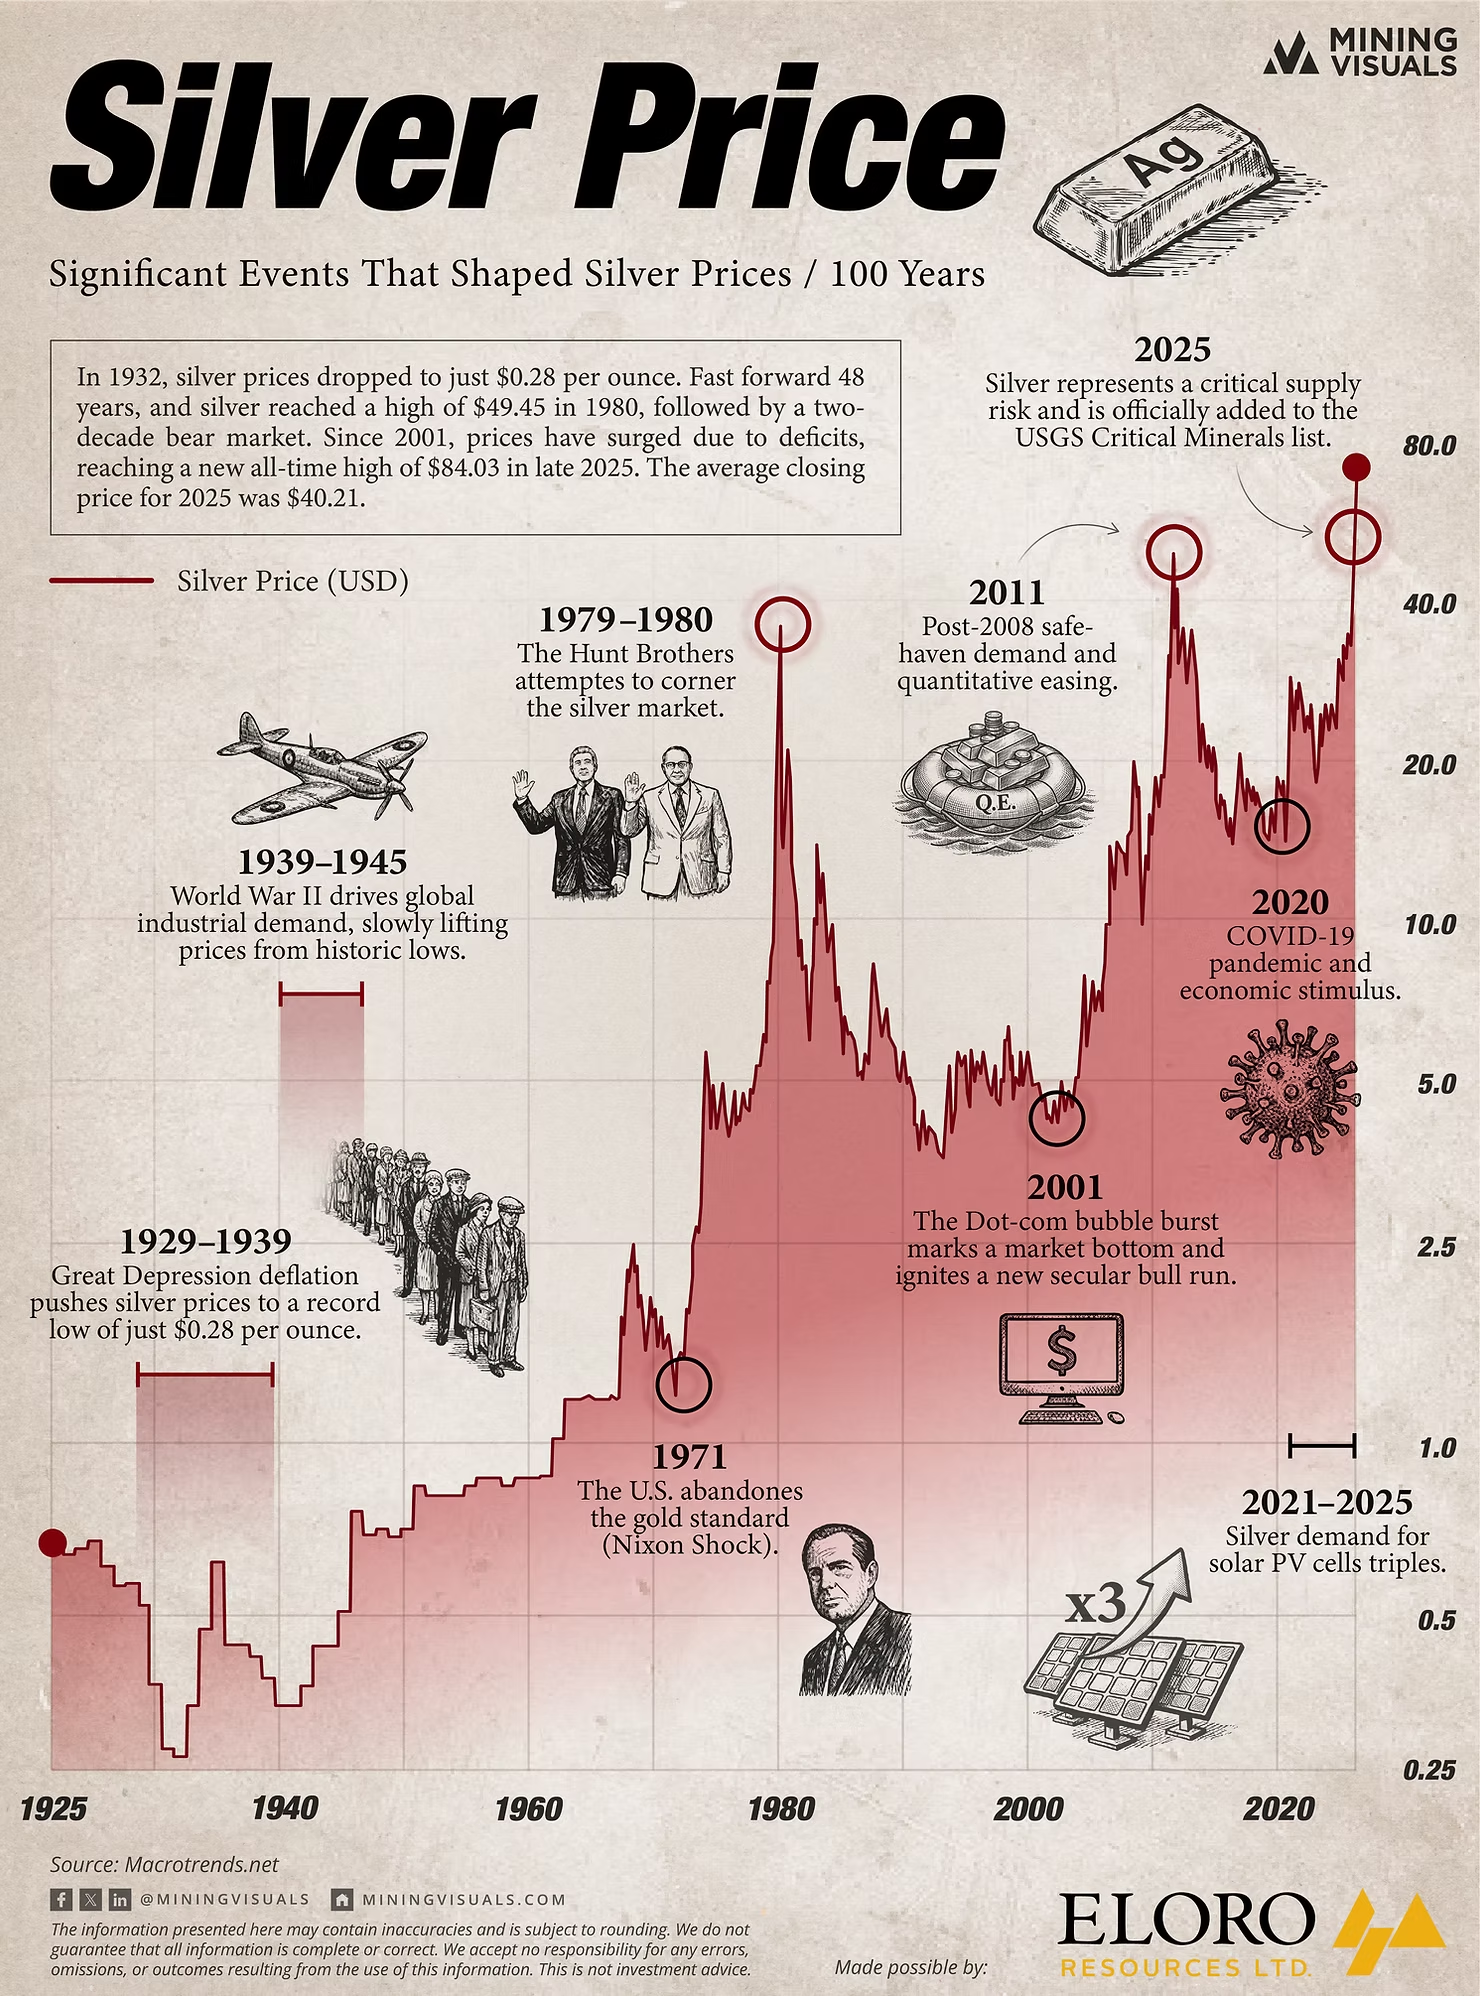
The infographic above tells a visual story of volatility, but the history of silver over the last 100 years is far more complex than a simple price chart can convey. It is a timeline defined by a struggle for identity: is silver money, or is it a critical industrial ingredient?
For investors today, understanding the "hidden history" behind these peaks and valleys is crucial. The chart shows when the price moved; this article explains why.
100 Years of Volatility: The Data
The following table contextualizes the major milestones shown in the infographic, adding historical nuance to the raw numbers.
The War Effort: Silver’s First "Industrial" Test
While the chart notes World War II, few investors realize how pivotal the 1940s were for silver's transition. During the war, copper was in short supply for shell casings. In a secret operation, the Manhattan Project borrowed 14,700 tons of silver from the U.S. Treasury to use as electrical conductors in the calutrons used to enrich uranium.

This was the moment silver’s identity began to shift. It was no longer just a monetary metal to be hoarded in vaults; it was the world’s most efficient conductor, essential for high-tech engineering. This event foreshadowed the USGS Critical Mineral designation we saw recently in 2025.
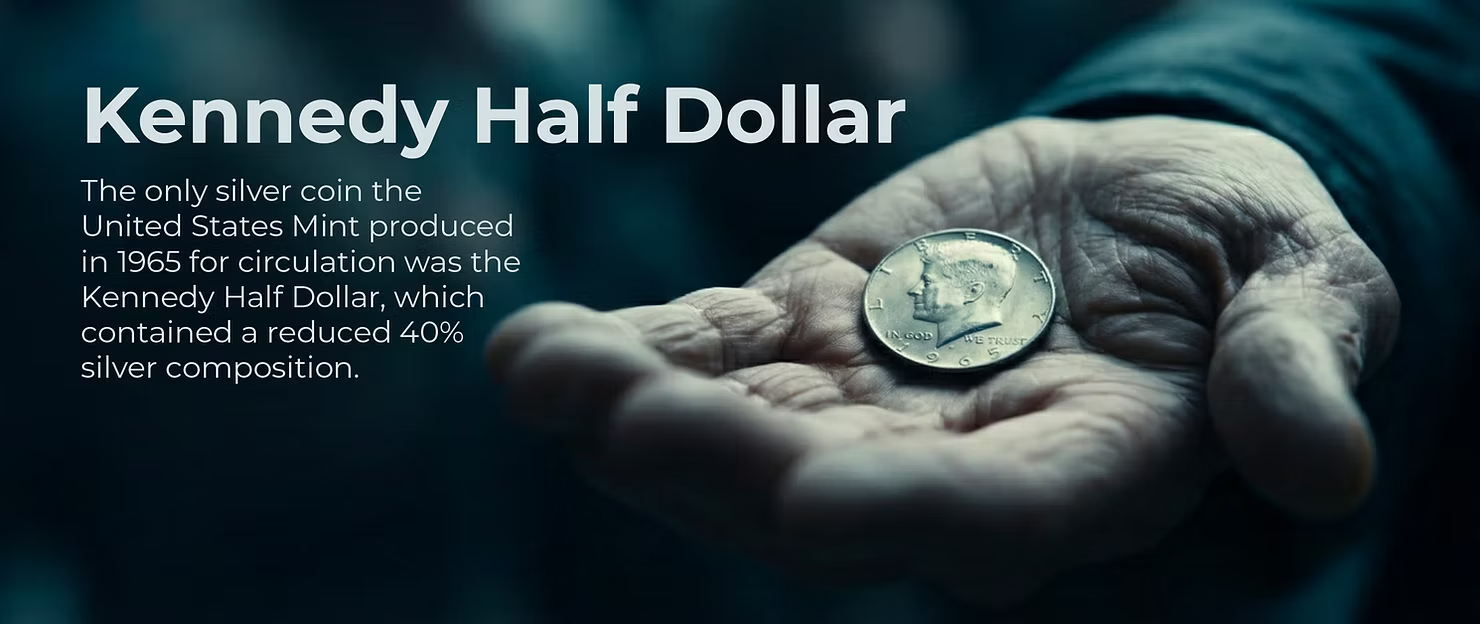
The "Coinage" Pivot (1965)
The steady climb shown in the chart from the 1960s onward was triggered by a specific legislative event. When President Lyndon B. Johnson signed the Coinage Act of 1965, he famously warned the public:
"There will be no profit in holding [silver coins] out of circulation for the value of their silver content."
The market bet against him. As the chart shows, the removal of silver from coinage didn't lower the price, it unpegged it. Freed from its fixed exchange rate, silver began its volatile march upward, driven by the realization that above-ground stocks were finally finite.
A Tale of Two Whales: Hunt vs. Buffett
The 1980 peak is famous for the Hunt Brothers, who attempted to corner the market. Their failure (and the subsequent crash shown in the 1980-1990 section of the chart) cast a long shadow over the metal.
However, a lesser-known chapter occurred in 1997-1998, during the accumulation phase shown before the 2000s rise. Warren Buffett quietly purchased 129.7 million ounces (nearly 3,500 tons) of silver. Unlike the Hunts, Buffett wasn't speculating on inflation; he was value investing. He recognized that inventory levels had fallen precipitously due to industrial use. This marked the beginning of the modern "supply deficit" narrative that defines the market today.
The 2025 Reality
We have now witnessed the latest chapter on this timeline. The resilience of the price post-2020 is unique because it lacks the "mania" of 1980.
As noted in the table, the market has been working through a multi-year structural deficit (Source: The Silver Institute).

Since 2021, the consumption of silver in green technologies, specifically solar PV and electrification, has consistently been in high demand.
Conclusion: The 100-Year Perspective
The true value of this timeline is perspective. While daily price action can appear chaotic, the 100-year view reveals a consistent pattern of resilience. From the deflationary lows of 1932 to the speculative peaks of 1980 and 2011, silver has repeatedly re-priced itself to reflect the economic reality of the time. The chart demonstrates that regardless of the catalyst, monetary or industrial, the metal has established a long-term trend of recovery and adaptation.
Sponsored by:

Eloro Resources Ltd. is a mineral exploration company advancing a world-class silver and tin project in Bolivia’s historic Potosí Department. Its flagship asset, the Iska Iska Project, ranks among the top five undeveloped global resources in terms of scale for both tin and silver.
This significant grassroots discovery remains open in multiple directions, offering substantial potential for continued expansion and resource enhancement. Iska Iska benefits from strong infrastructure access and a deeply rooted presence in Bolivia, supported by an experienced management team and meaningful community engagement.
Eloro’s strategy is focused on resource growth, strategic partnerships, and establishing a leading position within the global mining sector.
Learn more at
http://elororesources.com/Primary sources: Macrotrends.net (historical prices); Silver Institute World Silver Survey 2025 (supply/demand); USGS (critical minerals); live spot data as of Jan 4, 2026.
Disclaimer: This article is for informational purposes only and does not constitute investment advice or an offer to sell securities. The historical price data (sourced from Macrotrends) and market analysis regarding supply and demand are for educational purposes; past performance is not indicative of future results.


Explore More
View All

Silver in the Data Center: How AI's Power Crunch Is Building a New Pillar of Industrial Demand
Silver in the Data Center: How AI's Power Crunch Is Building a New Pillar of Industrial Demand
In early 2026, the artificial intelligence narrative shifted abruptly from software capabilities to physical hardware constraints. With tech giants committing hundreds of billions to new infrastructure—pushing global hyperscaler capital expenditures past $600 billion this year—the industry has collided with a new primary bottleneck: a severe power and thermal crunch.

Silver's Use Cases: A Visual Guide to Where the Metal Actually Goes
Silver's Use Cases: A Visual Guide to Where the Metal Actually Goes
Somewhere inside a pressurized-water reactor, an alloy that is four-fifths silver is absorbing neutrons to keep the core in check, a job most silver investors have never heard of. It is a useful reminder that the metal people picture as coins and jewelry mostly works elsewhere, across industry.

Ranked: The Countries That Produced the Most Silver in 2025
Ranked: The Countries That Produced the Most Silver in 2025
Mexico remained the world's top silver-producing country in 2025, mining 172.9 million ounces (Moz), roughly a fifth of global supply, according to the World Silver Survey 2026, produced for the Silver Institute by Metals Focus. But Mexico's lead narrowed: its output fell 5% for a third straight year, while second-place Peru climbed 7%. Global mine production rose 3% to 846.6 Moz, even as the ranking's top tier told a story of one leader sliding and its closest rival closing in.

Electric Vehicles Are Set to Become the Auto Industry's Biggest Silver Consumer by 2027
Electric Vehicles Are Set to Become the Auto Industry's Biggest Silver Consumer by 2027
Most of silver's 2026 story has been told from the supply side: a sixth straight year of structural deficit and a record price near $121 in January. Less examined is where the next leg of industrial demand actually comes from. With solar, silver's largest industrial use, now facing thrifting and substitution, the Silver Institute points to a quieter end-use picking up the slack: the automotive sector. A December 2025 study from Oxford Economics and the Silver Institute quantifies that shift, and the engine behind it is the electric vehicle.