Tin
November 18, 2025
3 min
Tin


For most people, tin is synonymous with the humble "tin can." But as our 2023 usage breakdown shows, this often-invisible metal is one of the most critical components of our digital lives and the green energy transition.
With global refined tin production at 370,100 tonnes in 2023, the demand story is no longer about just one application. It’s a diversified profile that balances traditional industrial uses with high-growth technology sectors.
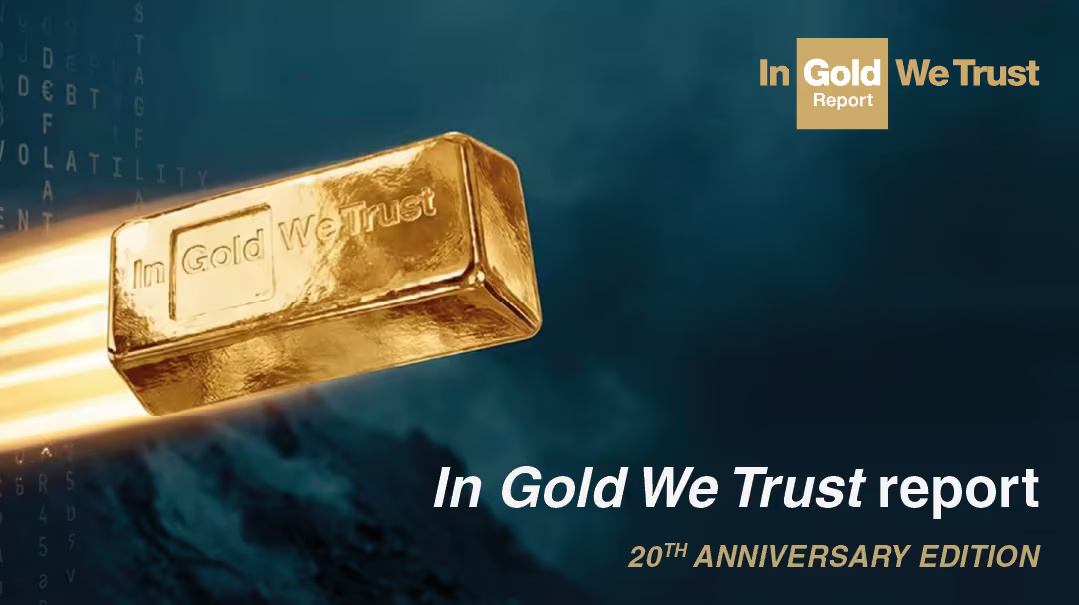
While global production saw a modest decline in 2023, data from the International Tin Association (ITA) shows that underlying tin usage is in a recovery cycle, moving past the 2023 semiconductor slump. The infographic provides a clear picture of exactly where this demand comes from.
Solder: The 51% Backbone of the Electronics World
The largest share of tin usage, by a significant margin, is solder (51% or 182,121 tonnes). Tin is the "conductive glue" in every electronic circuit board. As the infographic notes, a single smartphone can contain over 1,000 solder points, physically and electrically connecting every component.
This segment is the engine of tin demand, but it's also the most cyclical. It is directly tied to the health of the consumer electronics and semiconductor industries. After a difficult 2023, this sector is now in recovery. As demand for laptops, servers, and smartphones rebounds, this 51% segment is poised to strengthen.
Batteries & Alloys:
The second-largest segment, Batteries/Alloys/Other (22% or 78,562 tonnes), represents the future. This category is at the heart of the energy transition.
Tin is a critical element for "powering the future of mobility." It is increasingly being used to create high-performance anodes for the next generation of lithium-ion EV batteries. Beyond batteries, its anti-corrosive and high-performance properties make it essential for alloys in aerospace and other industrial applications.
This segment, along with tin's growing use in solar-panel ribbons, is a story of structural growth, providing a long-term demand driver that is less dependent on consumer electronics cycles.
Tinplate & Chemicals:
Finally, the traditional applications of Tin Chemicals (16%) and Tinplate (11%) provide a stable, non-cyclical floor for demand.
- Tinplate: This is the "gold standard" for food preservation. Tin's non-toxic and corrosion-resistant properties make it the perfect barrier to protect food, and it remains a vital industrial staple.
- Tin Chemicals: This segment includes a wide range of uses, such as tin oxide coatings that create stronger, scratch-resistant glass, and various catalysts used in manufacturing.
A Metal for Today and Tomorrow
The 2023 breakdown of tin usage shows a metal in transition. It has successfully bridged its past with the future. It is no longer just an industrial commodity but a critical technology metal.
This diversified demand profile, split between the cyclical electronics backbone, the high-growth energy transition, and the stable industrial base makes tin one of the most essential and resilient metals powering the 21st century.
Sponsored by:
Eloro Resources Ltd. is a mineral exploration company advancing a world-class silver and tin project in Bolivia’s historic Potosí Department. Its flagship asset, the Iska Iska Project, ranks among the top five undeveloped global resources in terms of scale for both tin and silver.
This significant grassroots discovery remains open in multiple directions, offering substantial potential for continued expansion and resource enhancement. Iska Iska benefits from strong infrastructure access and a deeply rooted presence in Bolivia, supported by an experienced management team and meaningful community engagement.
Eloro’s strategy is focused on resource growth, strategic partnerships, and establishing a leading position within the global mining sector.
Learn more at elororesources.com.
Source: International Tin Association (ITA) https://www.internationaltin.org/ita-study-tin-use-in-recovery-cycle/
Disclaimer: The information provided in this article and the accompanying infographic is for informational purposes only and should not be considered as financial or investment advice. While MiningVisuals has made every effort to ensure the accuracy and reliability of the information presented, which is based on the sources cited, we do not guarantee its completeness or accuracy. Market forecasts, projections, and analyses are based on data available at the time of publication and are inherently subject to change due to various factors. Readers are encouraged to conduct their own research and consult with a qualified financial advisor before making any investment decisions.



Explore More
View All

What Each Part of the Mining Ecosystem Does
What Each Part of the Mining Ecosystem Does
Metal starts as rock that no one has found yet. Exploration and drilling turn it into a known deposit. The deposit is then financed, built, equipped and mined, and its concentrate is smelted and refined into metal. Each stage is its own industry, with its own listed companies, and their revenue depends on different things. The section below explains how each step works and makes its money, with a recent example from each.
Pakistan’s Mineral Export Outlook to 2039 and the Pipeline Behind It
Pakistan’s Mineral Export Outlook to 2039 and the Pipeline Behind It
Pakistan’s mineral export earnings could reach US$10.46 billion a year by 2039, up from US$932 million in 2025, according to a tentative outlook from the Petroleum Division. Other estimates start from a higher base: a projection by the Institute of Cost and Management Accountants of Pakistan, reported by APP, puts current mineral exports at about US$3 billion.
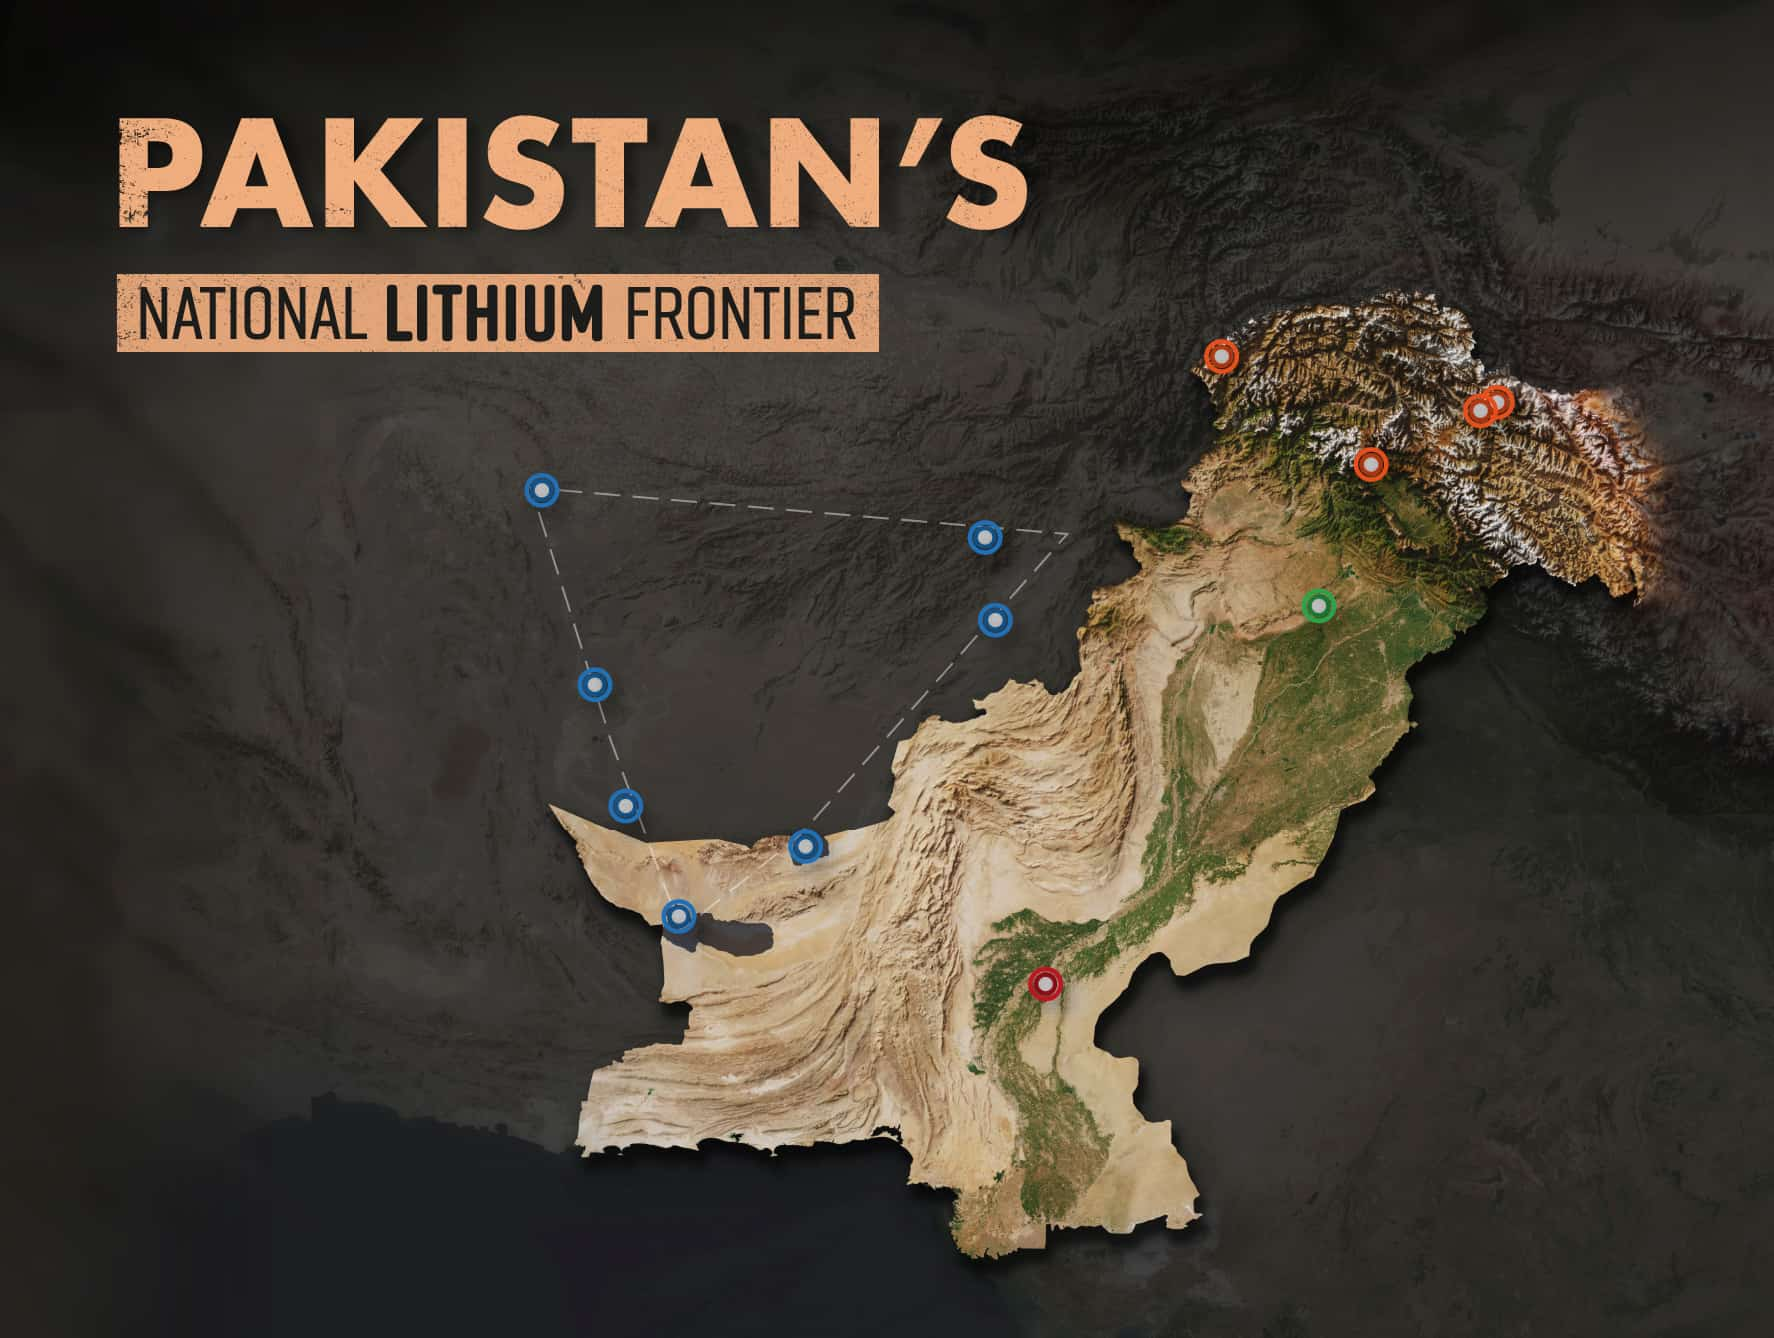
Where Lithium Has Been Identified Across Pakistan
Where Lithium Has Been Identified Across Pakistan
Lithium has been reported in four geological settings in Pakistan: brine lakes in Balochistan, geothermal well brine in Sindh, pegmatites in the northern mountains and clays in the Salt Range. A 2025 concept note by Geological Survey of Pakistan scientists describes these occurrences as potential and gives no resource estimates.
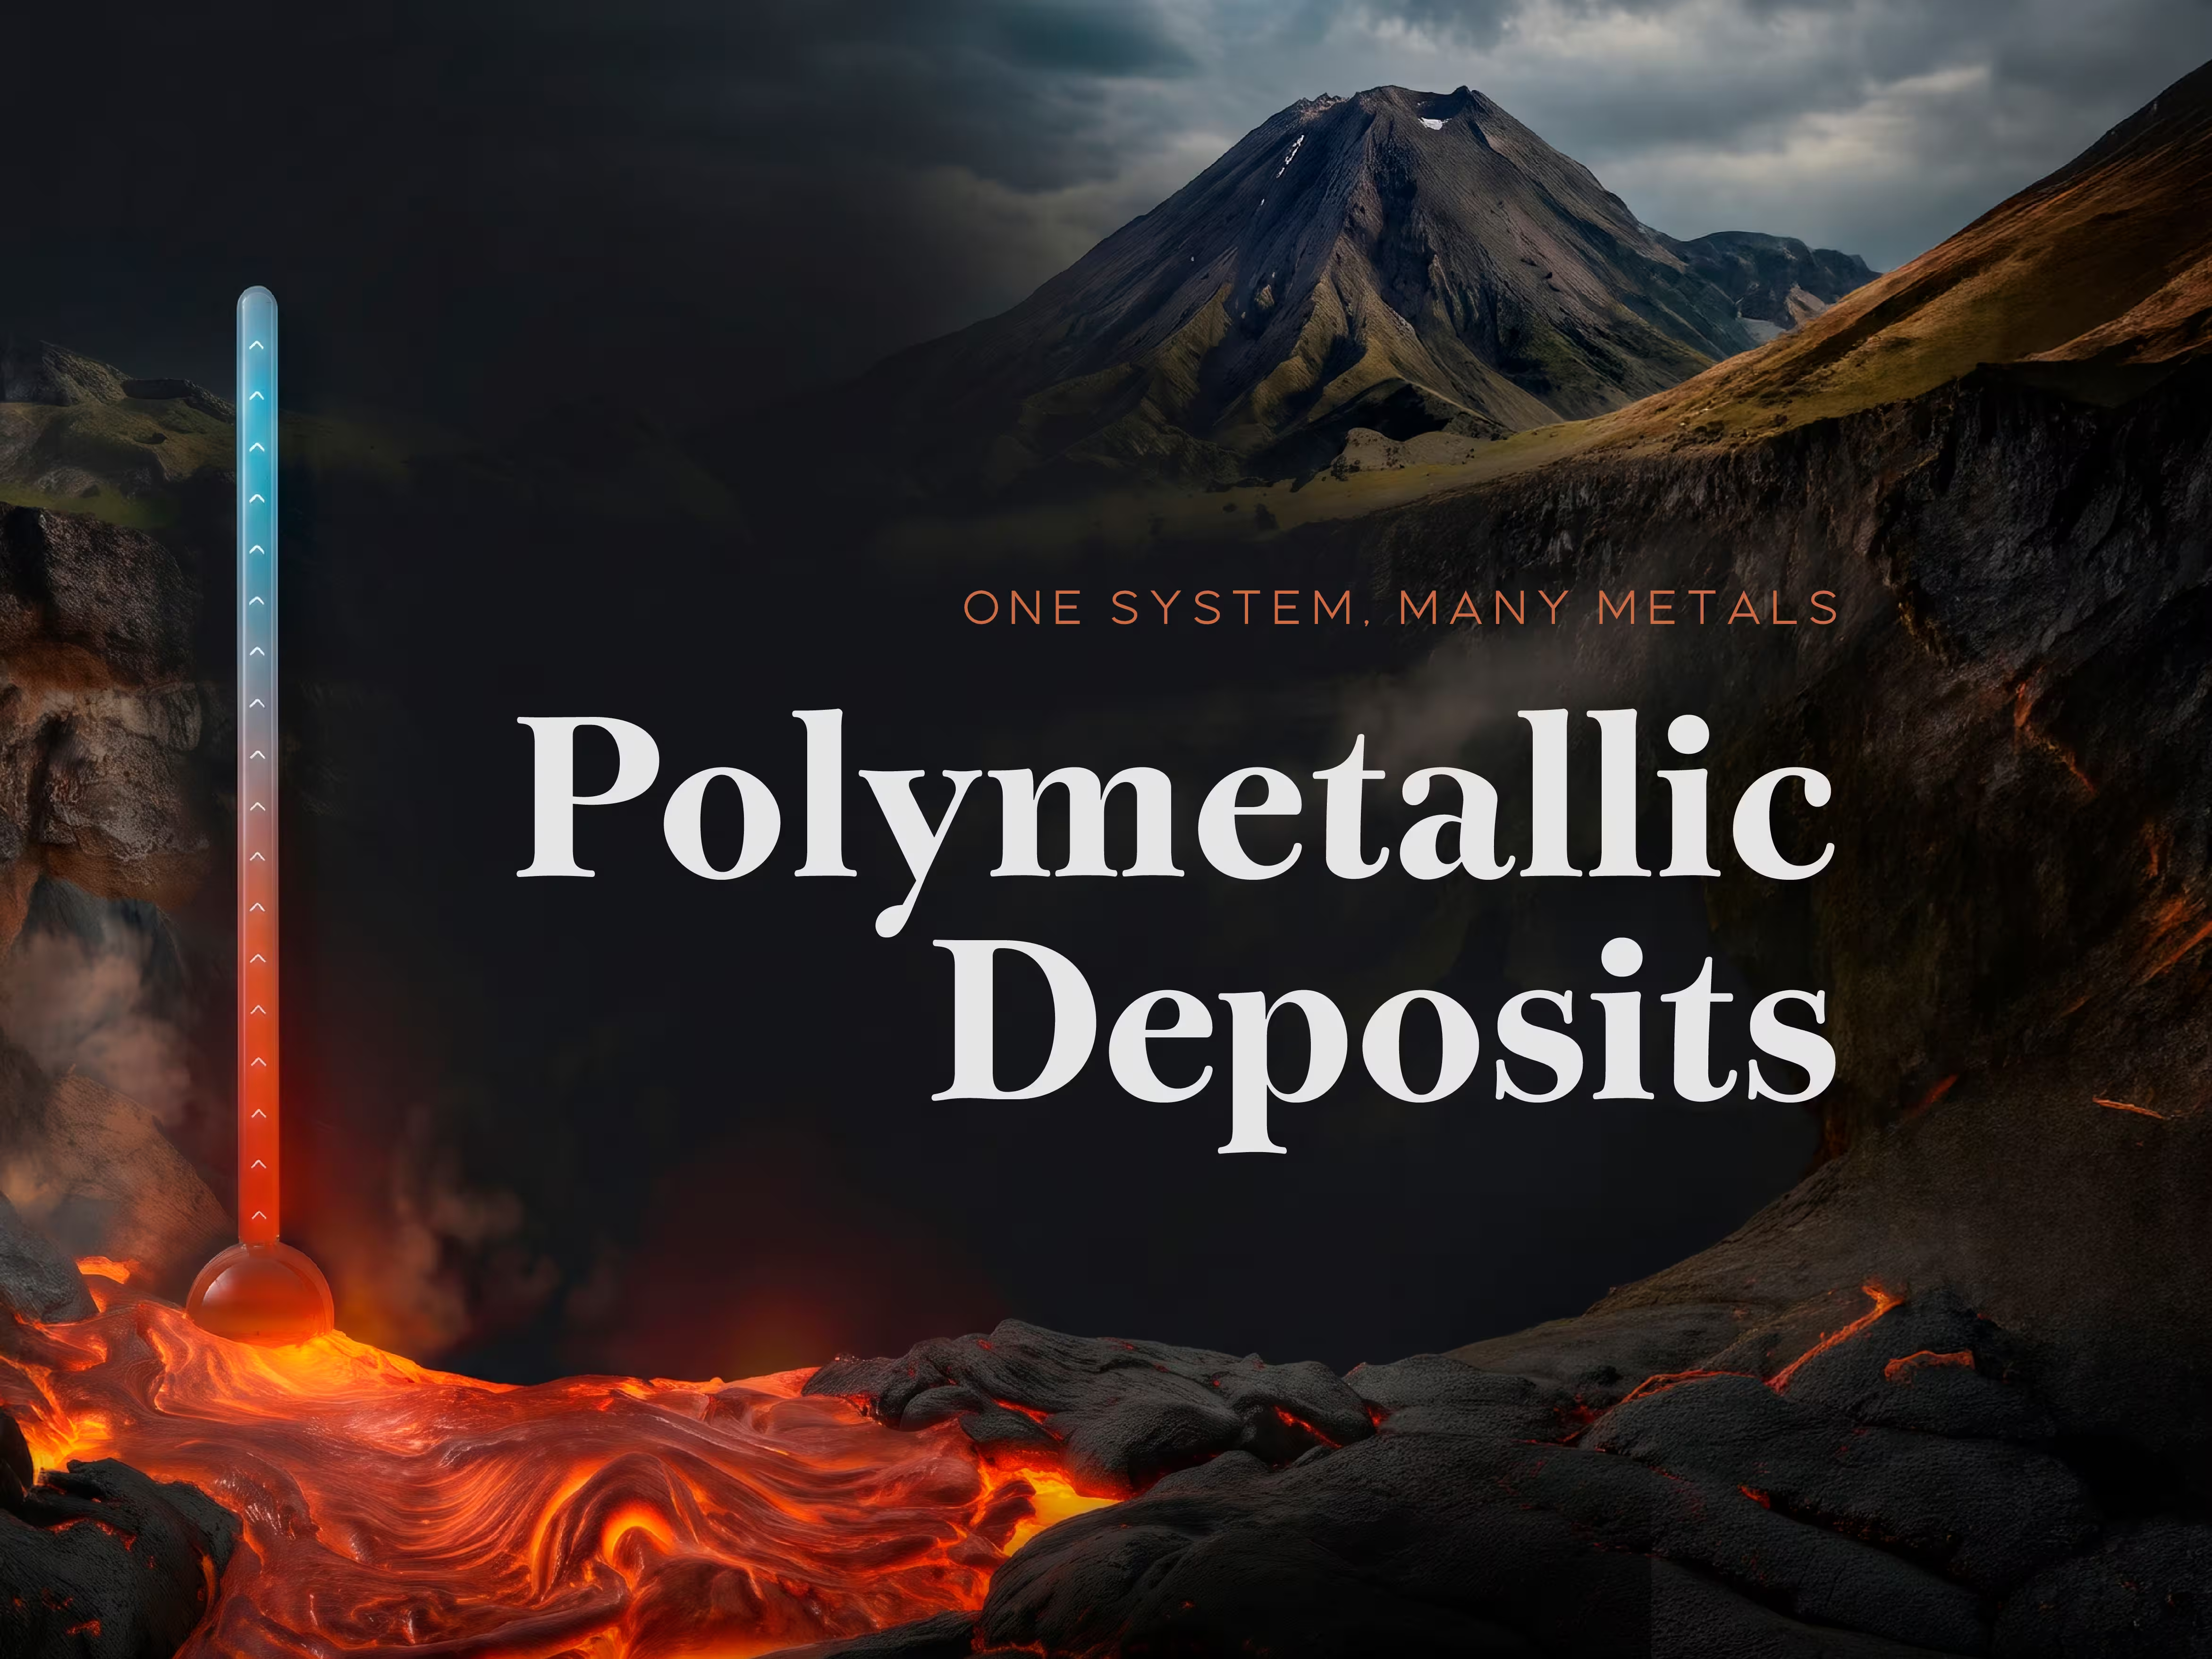
How Heat Sorts the Metals in a Polymetallic Deposit
How Heat Sorts the Metals in a Polymetallic Deposit
On November 6, 2025, the U.S. Interior Department added copper, silver and lead to its final critical minerals list, among 10 new entries. All three are main metals of a polymetallic deposit, where the USGS vein model places them in zones around a single intrusion. Silver shows how closely these metals are linked. The USGS says U.S. silver is "primarily obtained as a byproduct from lead-zinc, copper, and gold mines", and six smaller metals on the infographic reach the market the same way.