Precious Metals
December 10, 2025
2 min
Precious Metals

While physical gold is a store of value, gold mining stocks are a leveraged bet on the metal itself.
When bullion prices rise, miners often outperform the commodity they produce. This graphic visualizes the stock price performance of four of the world's largest gold producers from December 2022 to December 2025, showing just how explosive that leverage can be.
The Leaderboard (2022–2025)
As of December 3, 2025, the sector has seen a massive divergence in returns. Here is how the giants stack up:
AngloGold Ashanti leads the field with a 341% increase, while Newmont, despite being the world's largest producer, trailed with a 65% gain.
The "Gold-to-Miner" Multiplier
Why the triple-digit returns? The answer is operational leverage.
Mining companies have high fixed costs (labor, equipment, energy). Once the price of gold covers these costs, nearly every additional dollar flows straight to the bottom line. A 10% rise in the gold price can often lead to a 50% jump in a miner's profit margins.
Why The Divergence?
While the sector moves together, execution is key. AngloGold and Agnico Eagle separated themselves from the pack through superior cost control and jurisdiction management. Meanwhile, the two largest players faced significant headwinds:
- Newmont (NEM): The giant’s performance was weighed down by the complexity of integrating its massive Newcrest acquisition and a costly, months-long strike at its Peñasquito mine in Mexico (2023), which severely impacted free cash flow during a critical period for gold prices.
- Barrick Gold (GOLD): While profitable, Barrick struggled with geopolitical friction, notably disputes with the military government in Mali regarding its Loulo-Gounkoto complex, as well as a slower-than-expected ramp-up at its Pueblo Viejo expansion project.
Data Source: Market data and stock performance metrics sourced via TradingView. Performance data covers the period from December 2022 to December 3, 2025. Returns are calculated based on share price appreciation and do not include reinvested dividends unless otherwise noted.
Disclaimer: The content provided in this article and infographic is for informational and educational purposes only and does not constitute financial or investment advice. Past performance is not indicative of future results.


Explore More
View All
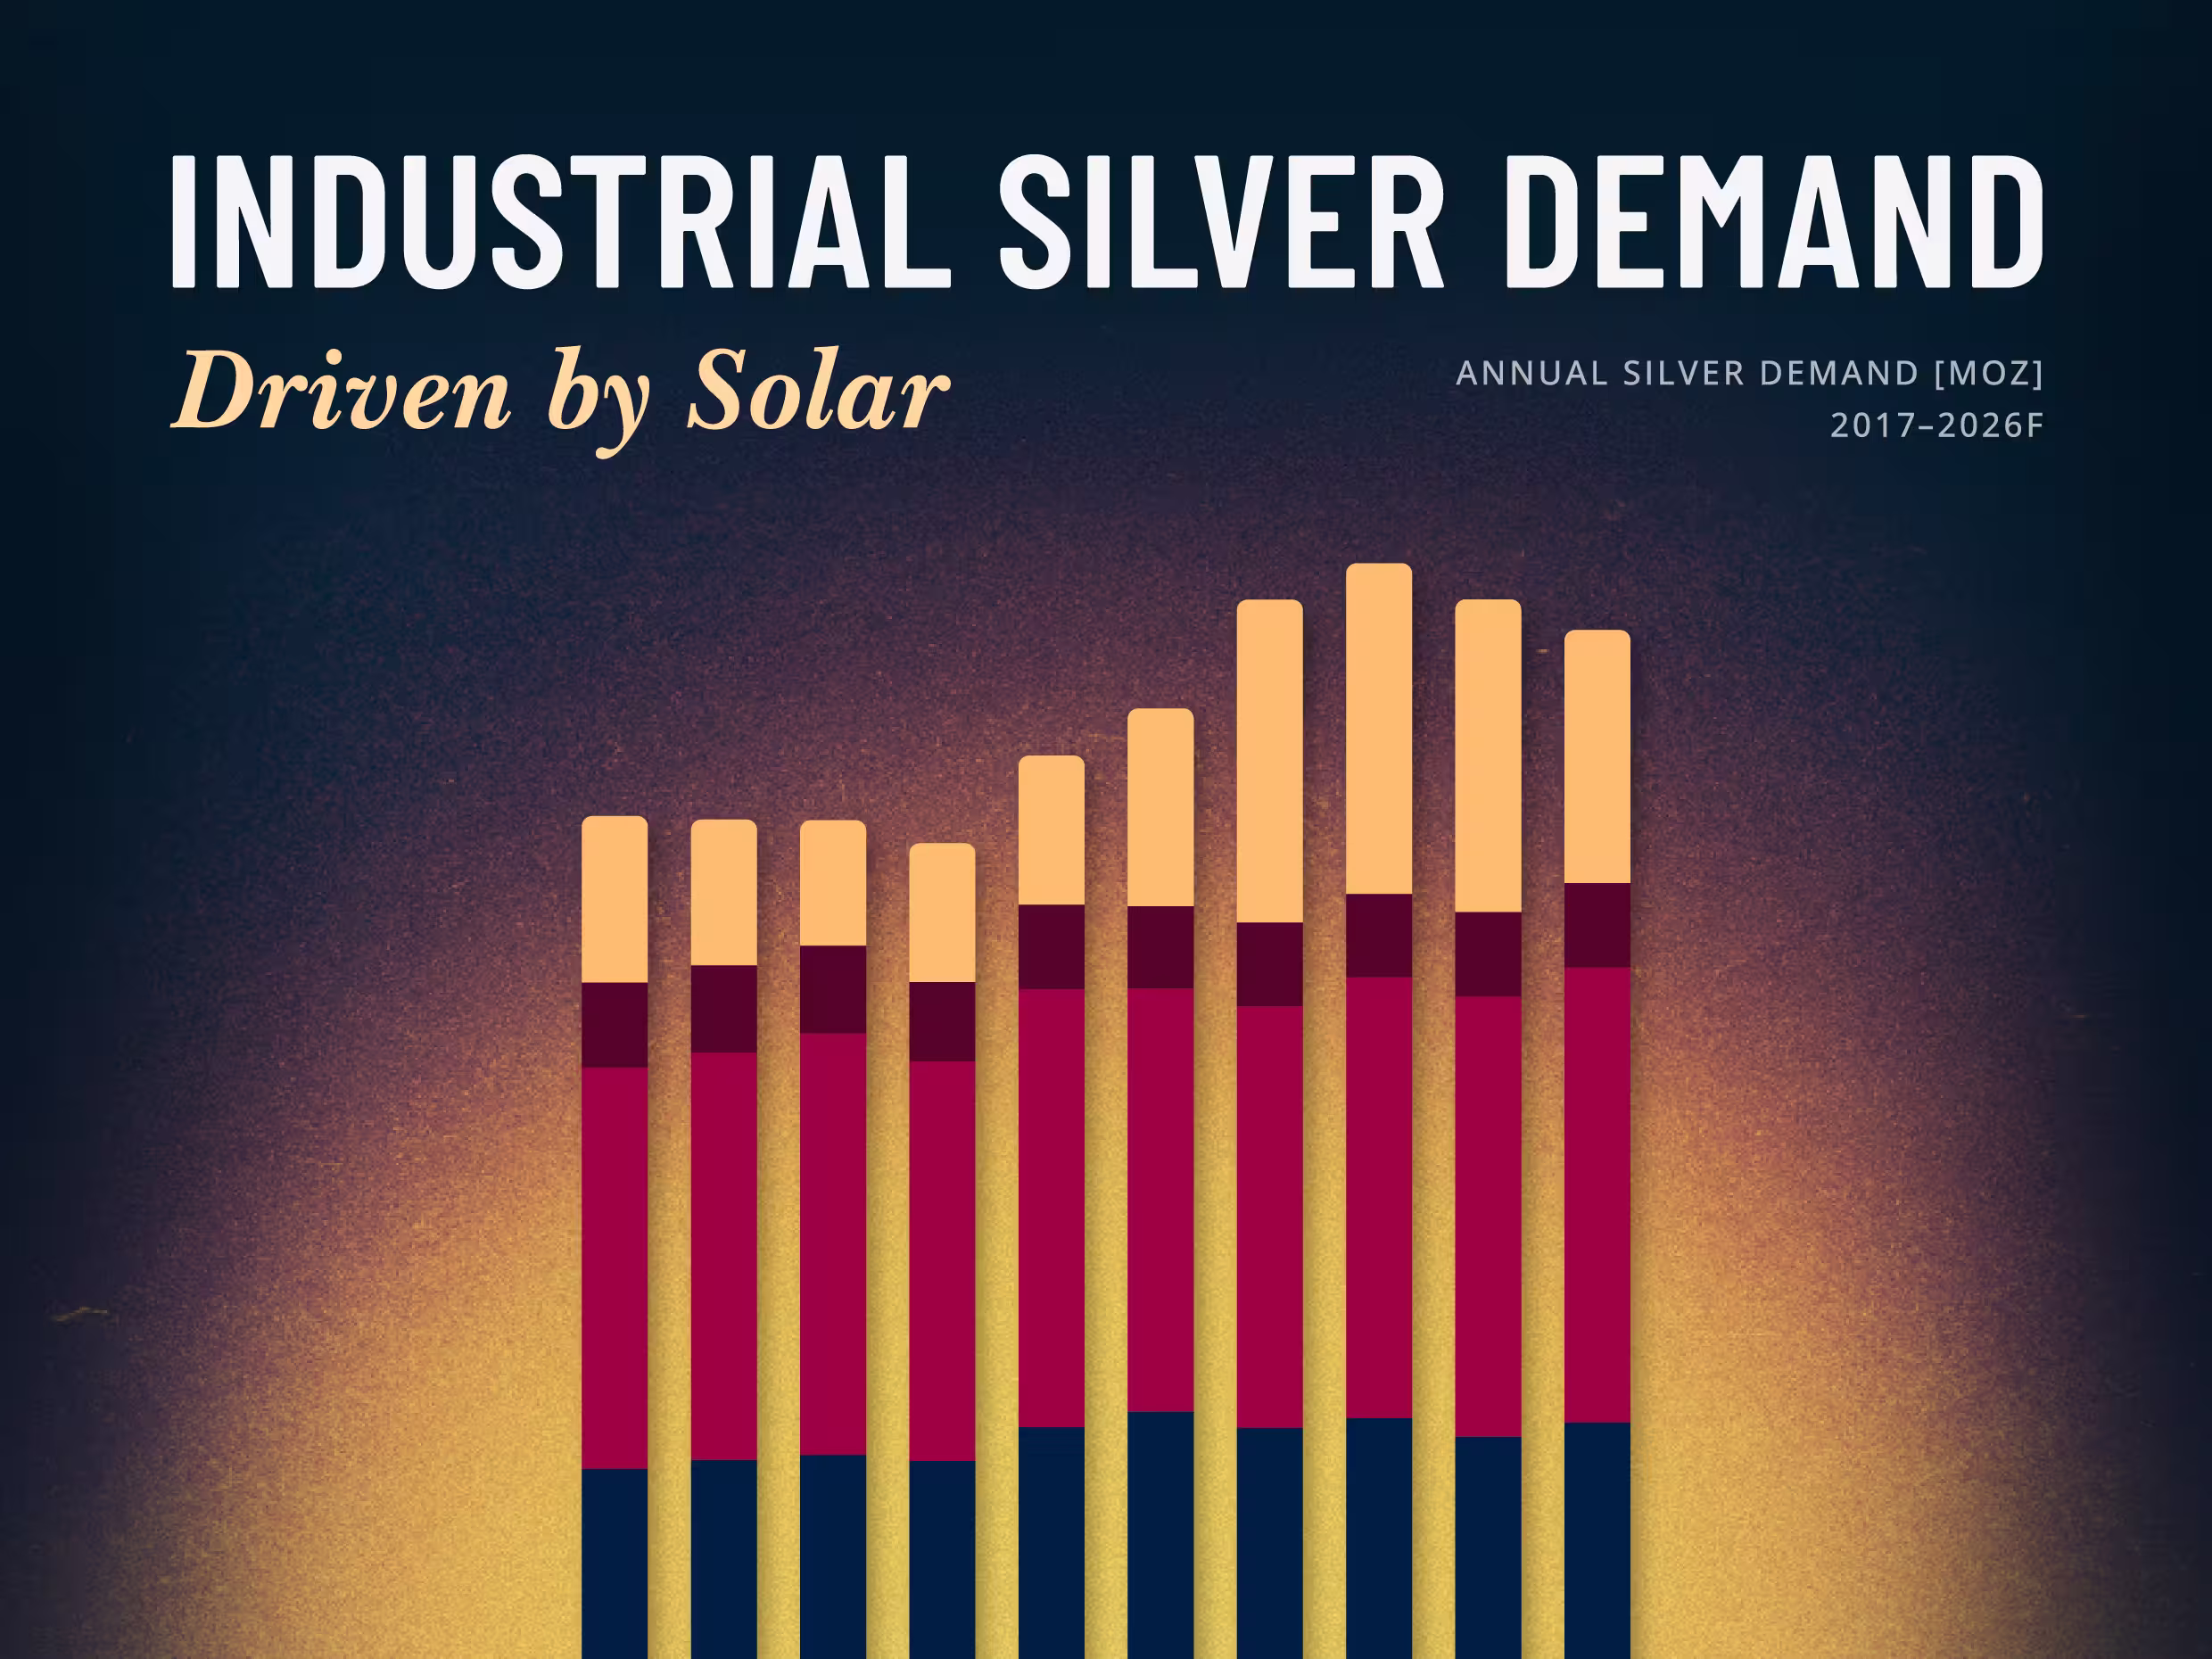
Solar Is Silver's Largest Industrial Market, and Not Easily Replaced
Solar Is Silver's Largest Industrial Market, and Not Easily Replaced
When LONGi Green Energy, the world's largest solar module maker, told investors on January 5, 2026 that it would begin mass-producing base-metal solar cells in the second quarter, it put a number on a pressure the whole industry feels. Solar is the largest single application within silver's industrial demand, and as the metal ran to a record above $121 an ounce in January, rising silver costs pushed manufacturers to accelerate efforts to reduce the metal per cell.

Silver in the Data Center: How AI's Power Crunch Is Building a New Pillar of Industrial Demand
Silver in the Data Center: How AI's Power Crunch Is Building a New Pillar of Industrial Demand
In early 2026, the artificial intelligence narrative shifted abruptly from software capabilities to physical hardware constraints. With tech giants committing hundreds of billions to new infrastructure—pushing global hyperscaler capital expenditures past $600 billion this year—the industry has collided with a new primary bottleneck: a severe power and thermal crunch.

Silver's Use Cases: A Visual Guide to Where the Metal Actually Goes
Silver's Use Cases: A Visual Guide to Where the Metal Actually Goes
Somewhere inside a pressurized-water reactor, an alloy that is four-fifths silver is absorbing neutrons to keep the core in check, a job most silver investors have never heard of. It is a useful reminder that the metal people picture as coins and jewelry mostly works elsewhere, across industry.

Ranked: The Countries That Produced the Most Silver in 2025
Ranked: The Countries That Produced the Most Silver in 2025
Mexico remained the world's top silver-producing country in 2025, mining 172.9 million ounces (Moz), roughly a fifth of global supply, according to the World Silver Survey 2026, produced for the Silver Institute by Metals Focus. But Mexico's lead narrowed: its output fell 5% for a third straight year, while second-place Peru climbed 7%. Global mine production rose 3% to 846.6 Moz, even as the ranking's top tier told a story of one leader sliding and its closest rival closing in.