Precious Metals
January 12, 2026
3 min
Precious Metals
The third quarter of 2025 was characterized by a significant disconnect between realized gold prices and production growth. While the average gold price reached $3,456 per ounce—a 40% increase over the same period in 2024—global mine production saw a more modest rise of 2%, totaling 977 tonnes according to World Gold Council data.
This pricing environment allowed major producers to generate substantial free cash flow, providing a buffer against persistent inflationary pressures and the technical challenges of maturing mine lives.
Operational Performance of Global Majors
The quarter’s results reflect a period of transition for several of the industry's largest players, where financial gains often outpaced physical output.
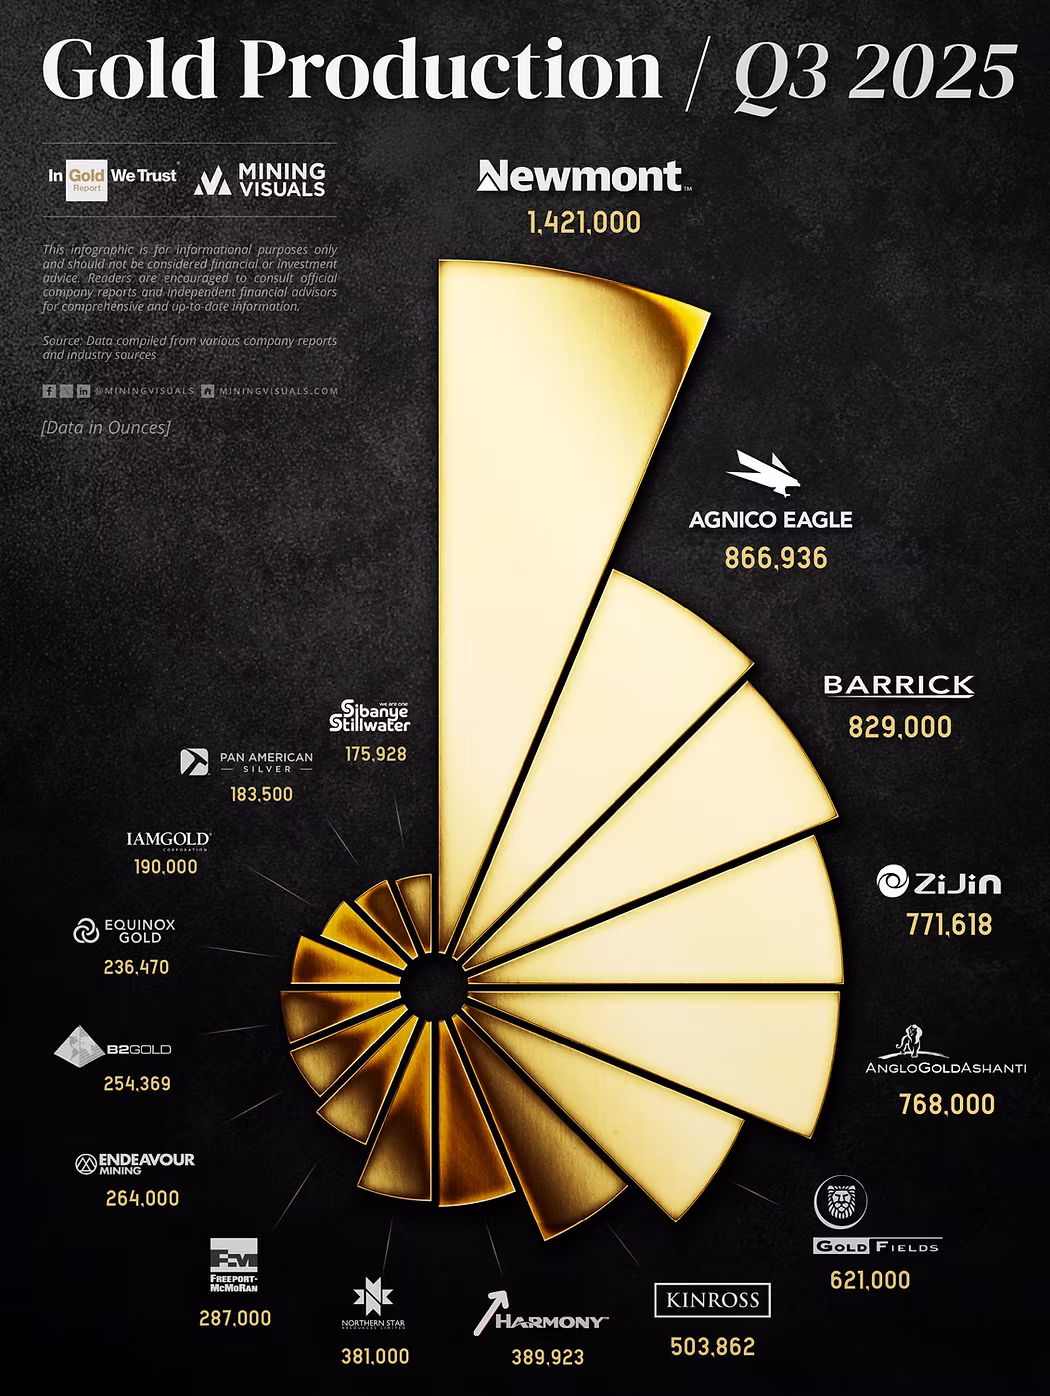
Newmont: Reported attributable production of approximately 1.4 million ounces. This figure represents a sequential decline, attributed largely to scheduled maintenance cycles at the Peñasquito (Mexico) and Lihir (PNG) operations. Despite the volume dip, the company reported $1.6 billion in free cash flow, supported by a sustained focus on reducing G&A expenses, which saw an $85 million reduction this quarter.
Agnico Eagle: Maintained a stable production profile with 867,000 ounces. The company’s All-In Sustaining Costs (AISC) remained relatively controlled at $1,373 per ounce. With 77% of its full-year guidance met by the end of September, the company appears positioned to hit its annual targets, supported by consistent performance at the Meadowbank and LaRonde complexes.
Barrick Gold: Mark Bristow’s outfit saw a 12% year-over-year decline in output (829,000 ounces) due to disruptions in Mali. However, the Nevada Gold Mines JV remains the world’s most formidable "anchor" asset, and costs improved markedly with AISC down 9% sequentially to $1,538/oz. Barrick’s record $1.5 billion in free cash flow funded a 25% dividend hike, signaling a clear shift toward returning capital to shareholders.
Regional Growth and Emerging Projects
While the senior producers focused on value over volume, significant growth was observed in specific geographical regions and through new project commissions.
The ramp-up of Gold Fields’ Salares Norte project was a notable contributor, delivering 112,000 equivalent ounces. This helped the company reduce its group-level AISC by 10% sequentially. Meanwhile, Zijin Mining continued its trajectory of aggressive growth, reporting a 20% year-over-year increase in mined gold for the first nine months of the year.
Structural Challenges and Outlook
The sector continues to face headwinds that temper the benefits of the high gold price. Royalty payments, which are often linked to the spot price, have increased significantly, in some cases adding over $100 per ounce to operating costs. Additionally, seasonal weather patterns in West Africa continue to impact quarterly consistency.
Looking toward 2026, the industry's focus remains on project execution. The development of Newmont’s Ahafo North and Kinross’s Antelope project will be critical to sustaining production levels as older assets face declining grades. For the remainder of 2025, observers will likely focus on whether companies can maintain cost discipline if the gold price remains at these elevated levels.
Sources
This article is based on official Q3 2025 quarterly reports, production updates, and earnings releases from the respective companies, as published on their investor relations websites and filed with relevant regulatory bodies (e.g., SEDAR+, EDGAR, JSE, ASX, HKEX) in October and November 2025:
- Newmont Corporation – Q3 2025 Earnings Release and MD&A
- Agnico Eagle Mines Limited – Q3 2025 Financial and Operating Results
- Barrick Gold Corporation – Third Quarter 2025 Results
- Zijin Mining Group Co., Ltd. – 2025 Third Quarterly Report
- AngloGold Ashanti PLC – Q3 2025 Production and Operational Update
- Gold Fields Limited – Quarter Ended 30 September 2025 Results
- Additional supporting data drawn from company presentations, webcasts, and press releases issued during the October–November 2025 reporting season.
Gold price data referenced from London Bullion Market Association (LBMA) Gold Price PM fix averages and realized prices disclosed in company reports.
Disclaimer
The information presented in this article is for informational purposes only and is based on publicly available company reports and disclosures as of December 2025. Production figures represent attributable gold ounces unless otherwise stated. Minor differences in reported numbers may arise from rounding, final audit adjustments, or differences between preliminary and final reports.


Explore More
View All

Silver in the Data Center: How AI's Power Crunch Is Building a New Pillar of Industrial Demand
Silver in the Data Center: How AI's Power Crunch Is Building a New Pillar of Industrial Demand
In early 2026, the artificial intelligence narrative shifted abruptly from software capabilities to physical hardware constraints. With tech giants committing hundreds of billions to new infrastructure—pushing global hyperscaler capital expenditures past $600 billion this year—the industry has collided with a new primary bottleneck: a severe power and thermal crunch.

Silver's Use Cases: A Visual Guide to Where the Metal Actually Goes
Silver's Use Cases: A Visual Guide to Where the Metal Actually Goes
Somewhere inside a pressurized-water reactor, an alloy that is four-fifths silver is absorbing neutrons to keep the core in check, a job most silver investors have never heard of. It is a useful reminder that the metal people picture as coins and jewelry mostly works elsewhere, across industry.

Ranked: The Countries That Produced the Most Silver in 2025
Ranked: The Countries That Produced the Most Silver in 2025
Mexico remained the world's top silver-producing country in 2025, mining 172.9 million ounces (Moz), roughly a fifth of global supply, according to the World Silver Survey 2026, produced for the Silver Institute by Metals Focus. But Mexico's lead narrowed: its output fell 5% for a third straight year, while second-place Peru climbed 7%. Global mine production rose 3% to 846.6 Moz, even as the ranking's top tier told a story of one leader sliding and its closest rival closing in.

Electric Vehicles Are Set to Become the Auto Industry's Biggest Silver Consumer by 2027
Electric Vehicles Are Set to Become the Auto Industry's Biggest Silver Consumer by 2027
Most of silver's 2026 story has been told from the supply side: a sixth straight year of structural deficit and a record price near $121 in January. Less examined is where the next leg of industrial demand actually comes from. With solar, silver's largest industrial use, now facing thrifting and substitution, the Silver Institute points to a quieter end-use picking up the slack: the automotive sector. A December 2025 study from Oxford Economics and the Silver Institute quantifies that shift, and the engine behind it is the electric vehicle.