Copper
May 30, 2025
3 min
Copper

The copper production numbers for the first quarter of 2025 are in. In this article, we take a closer look at the top producers, standout performances, and year-over-year trends shaping the global copper industry.
Top 3 by Output
- BHP kicked off Q1 2025 with a commanding performance, leading the pack in copper output with 513,200 metric tons—a robust 10.15% increase from Q1 2024. The core of BHP's growth stemmed from its flagship Escondida mine in Chile. Escondida saw a 20% increase in output, driven by higher ore grades (up to 1.05% from 0.85% in Q1 FY24) and improved concentrator throughput. This efficiency was further bolstered by advanced operational refinements and technological investments across their portfolio, including AI-driven systems at Olympic Dam and enhanced bioleaching.
- Freeport-McMoRan recorded a 20.00% drop in copper production in Q1 2025 compared to Q1 2024, yielding 393,718 tonnes. This decline was primarily driven by lower average ore grades, particularly at their Grasberg complex in Indonesia, as the mine navigated expected transitional phases. While a temporary operational adjustment, this reduced the amount of copper extracted per tonne of ore. Despite the dip, Freeport-McMoRan remains a significant global producer, managing these fluctuations as part of their long-term mine plans.
- Codelco, Chile’s state-owned mining giant, secured third place with 324,000 tonnes, posting a modest 1.57% increase.
Biggest Year-on-Year Increases
- MMG's copper production surged by a remarkable 76% in Q1 2025 compared to Q1 2024, reaching 118,213 tonnes. This significant increase was primarily fueled by strong operational performance at its key assets: improved ore grades and recovery rates at the Las Bambas mine, the successful ramp-up of the sulphide circuit at Kinsevere, and a full quarter of production from the recently acquired Khoemacau asset.
- Ivanhoe Mines surged by 54.43%, reaching 133,120 tonnes, a significant increase from Q1 2024. This was primarily driven by the successful ramp-up of the Phase 3 concentrator at its Kamoa-Kakula Copper Complex in the Democratic Republic of Congo. Record ore milled volumes (3.72 million tonnes) and improved power availability allowed for sustained higher operational rates, significantly boosting their copper output.
- Rio Tinto delivered a strong 34.62% growth, totaling 210,000 tonnes. This was primarily due to the continued ramp-up and increased throughput at its Oyu Tolgoi underground mine in Mongolia, alongside higher grades and improved recovery rates at Kennecott in the USA.
Largest Year-on-Year Declines
Some major players faced headwinds and saw production fall:
- Glencore suffered the largest drop at -29.95%, primarily due to lower ore mining rates, head grades, and overall recoveries at key operations like Collahuasi, Antapaccay, and KCC. This aligns with their expectation that Q1 would be the weakest quarter for copper output, with a stronger performance anticipated in the latter half of the year.
- Anglo American saw a -14.70% decrease in copper production in Q1 2025 compared to Q1 2024. This was primarily due to planned lower output in their Chilean operations, specifically at Collahuasi, which is in a transition phase with lower grades expected in the first half of the year. This decrease was partially offset by higher grades and strong operational performance from their Peruvian operations, particularly Quellaveco and Los Bronces.
Source: Data compiled from various company reports and industry sources
This infographic is for informational purposes only and should not be considered financial or investment advice. Readers are encouraged to consult official company reports and independent financial advisors for comprehensive and up-to-date information.


Explore More
View All
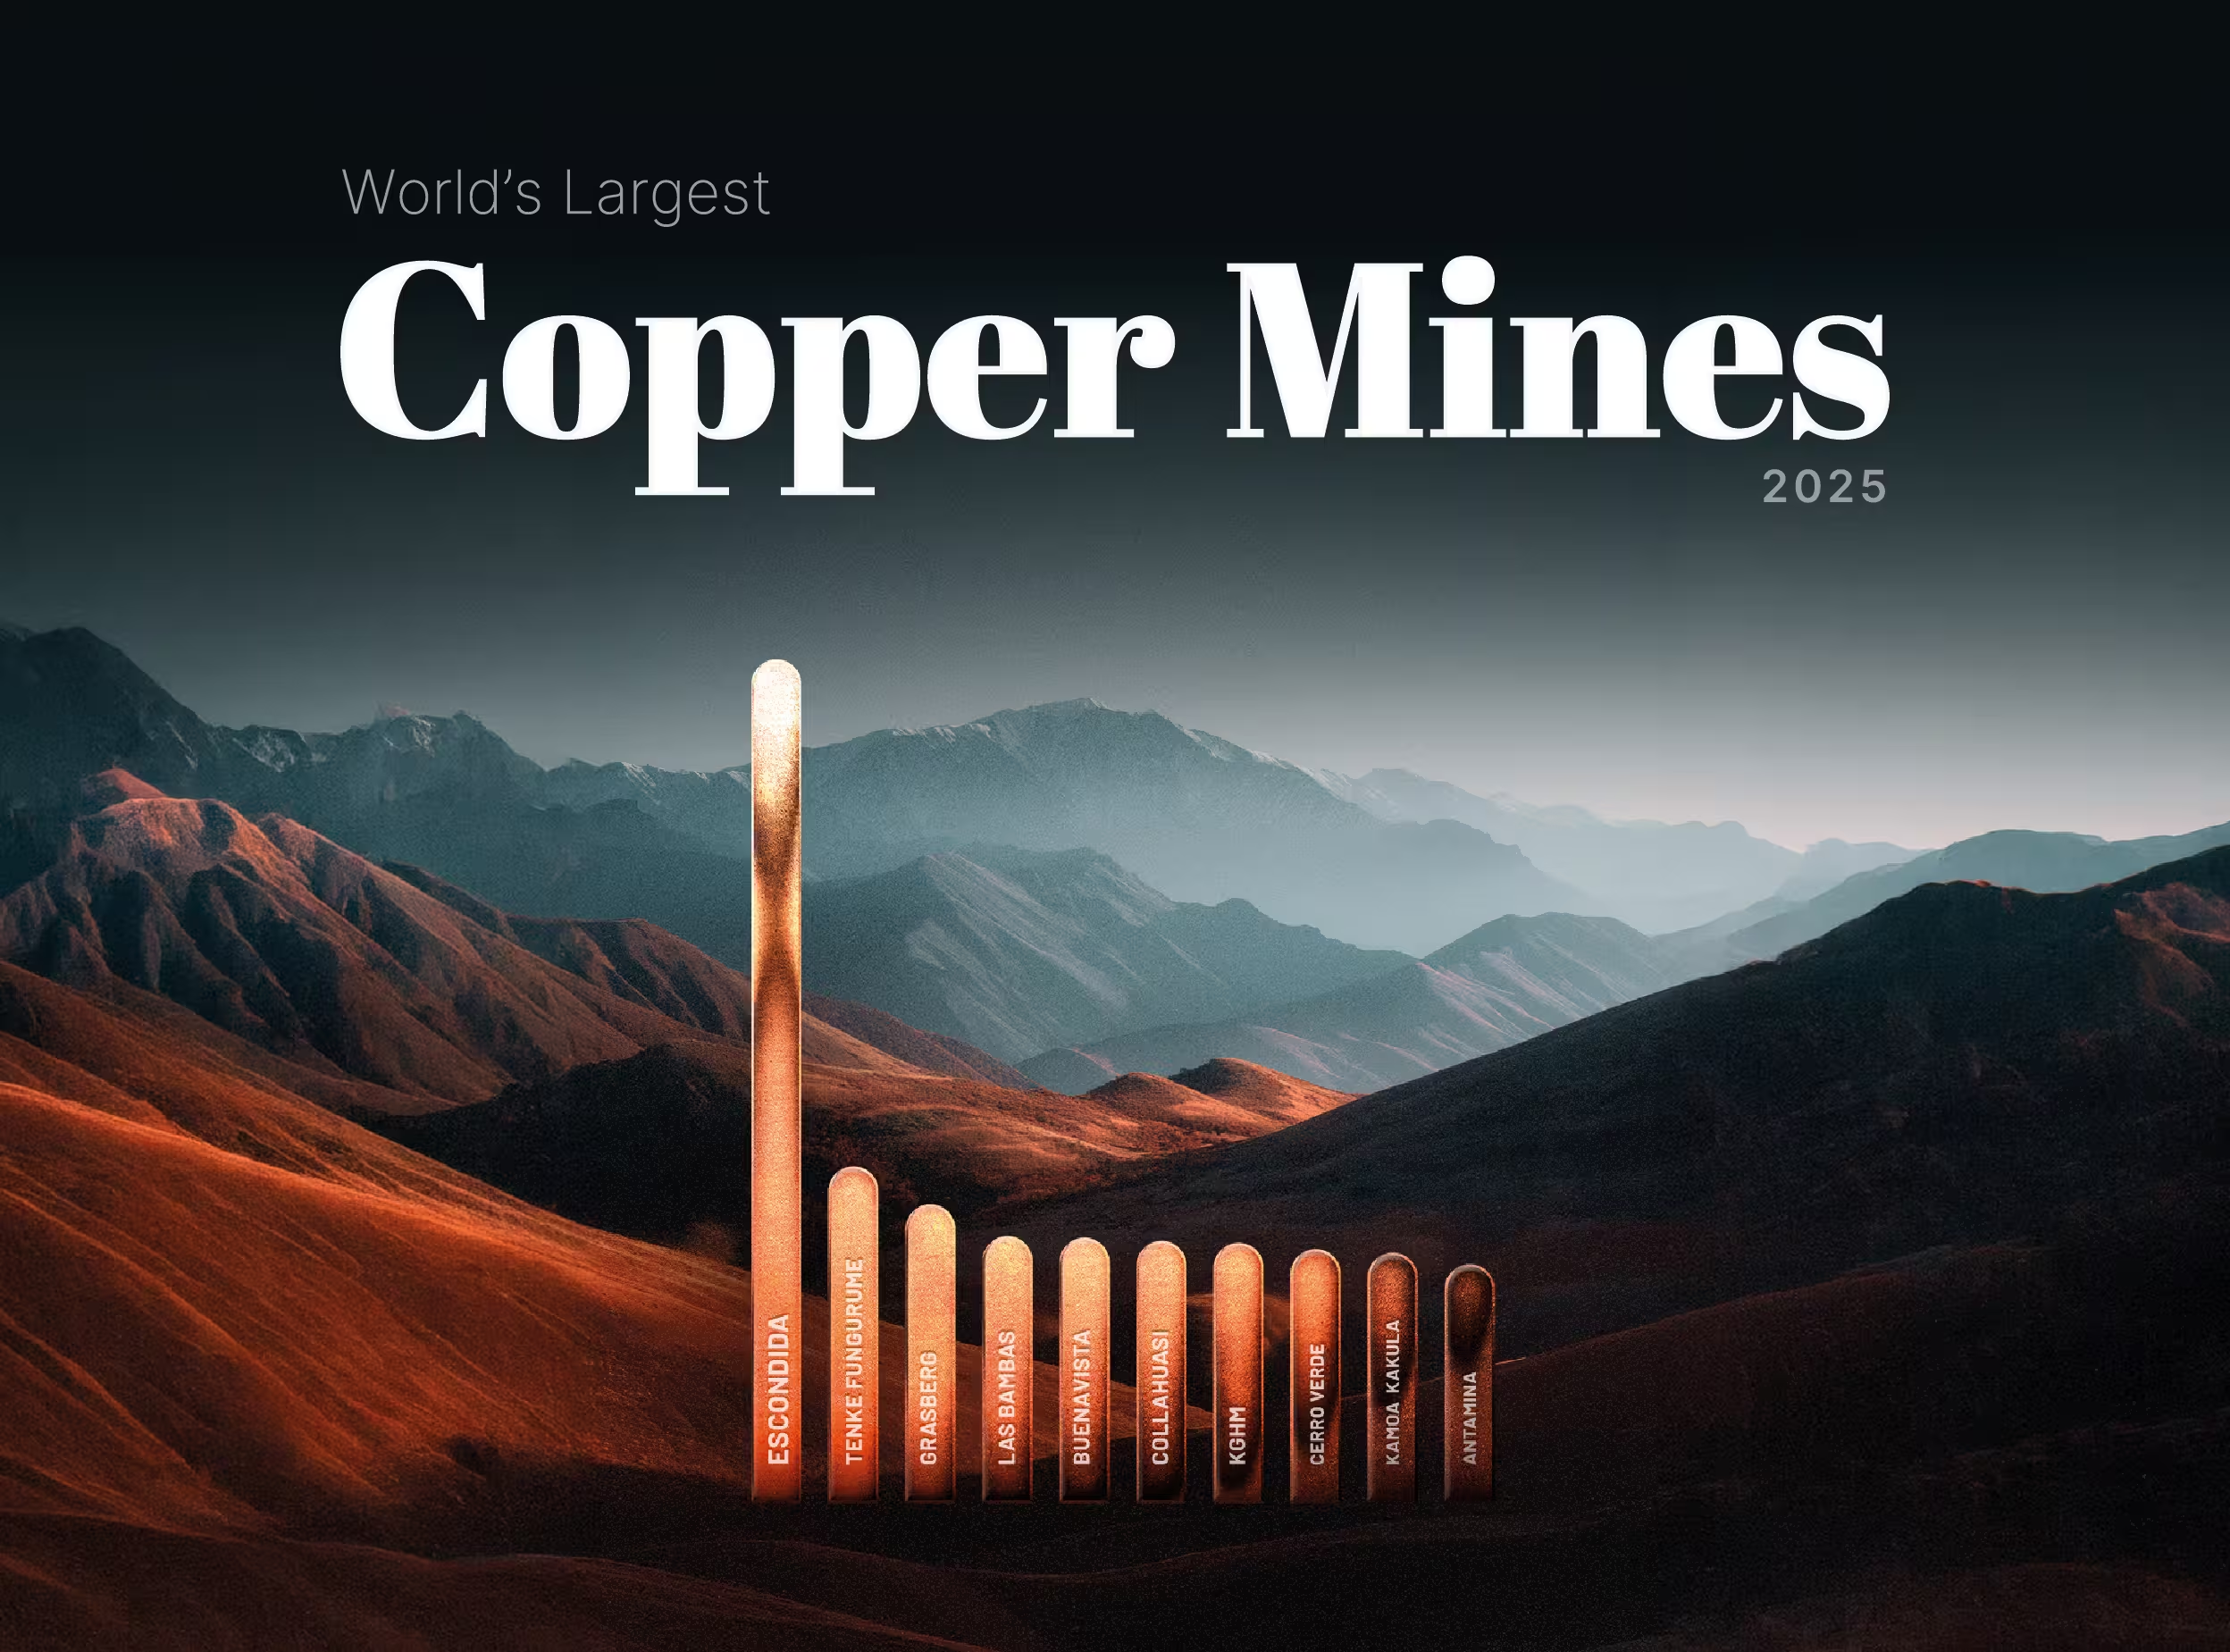
Ranked: The World's Largest Copper Mines (2025)
Ranked: The World's Largest Copper Mines (2025)
Copper has spent 2026 setting records, touching an intraday COMEX high of $6.71 per pound on May 13 amid AI-driven demand and supply shocks, against a backdrop where the ICSG now forecasts a 150,000-tonne deficit for 2026. In a market this tight, where the deficit thesis turns on lost tonnes, the question of where the world's copper actually comes from carries unusual weight.

Copper on Track for Its Highest Monthly Close on Record: A Look at the Drivers
Copper on Track for Its Highest Monthly Close on Record: A Look at the Drivers
Copper has spent most of 2026 doing something it had not done in a quarter century: setting fresh records every few weeks. The COMEX contract printed an intraday all-time high of $6.71 per pound on May 13, and the May monthly close looks set to land at the top of the historical chart. In London, copper traded above $14,000 per tonne in mid-May, touching $14,196.50, within reach of the LME's January 29 record of $14,527.50.

The Cost of Mining Copper: A 2024–2025 Update
The Cost of Mining Copper: A 2024–2025 Update
Copper futures touched an all-time high above $6.58 per pound on May 12, 2026, capping a 40.86% gain over the prior twelve months as supply tightness collided with structural demand from grid build-out, electric vehicles, and AI data centers. Earlier in the year, the LME benchmark rallied 22% to a record $13,387 per tonne on January 6, 2026. Behind the price action lies a less-discussed story: what it actually costs the world's largest miners to pull a pound of copper out of the ground.
Copper Production Q4 2025
Copper Production Q4 2025
As power-hungry AI data centers drive a projected 2-million-ton surge in global copper demand by 2030, market attention remains fixated on the supply side. Fourth-quarter 2025 metrics provide a definitive look at how the world's top miners closed out the year. While overall volumes remain heavily concentrated among a few historic industry giants, the true Q4 narratives emerged further down the list, as mid-tier producers leveraged flagship asset expansions to hit multi-year highs and offset the sector's ongoing struggle with declining ore grades.