%20Main.avif)
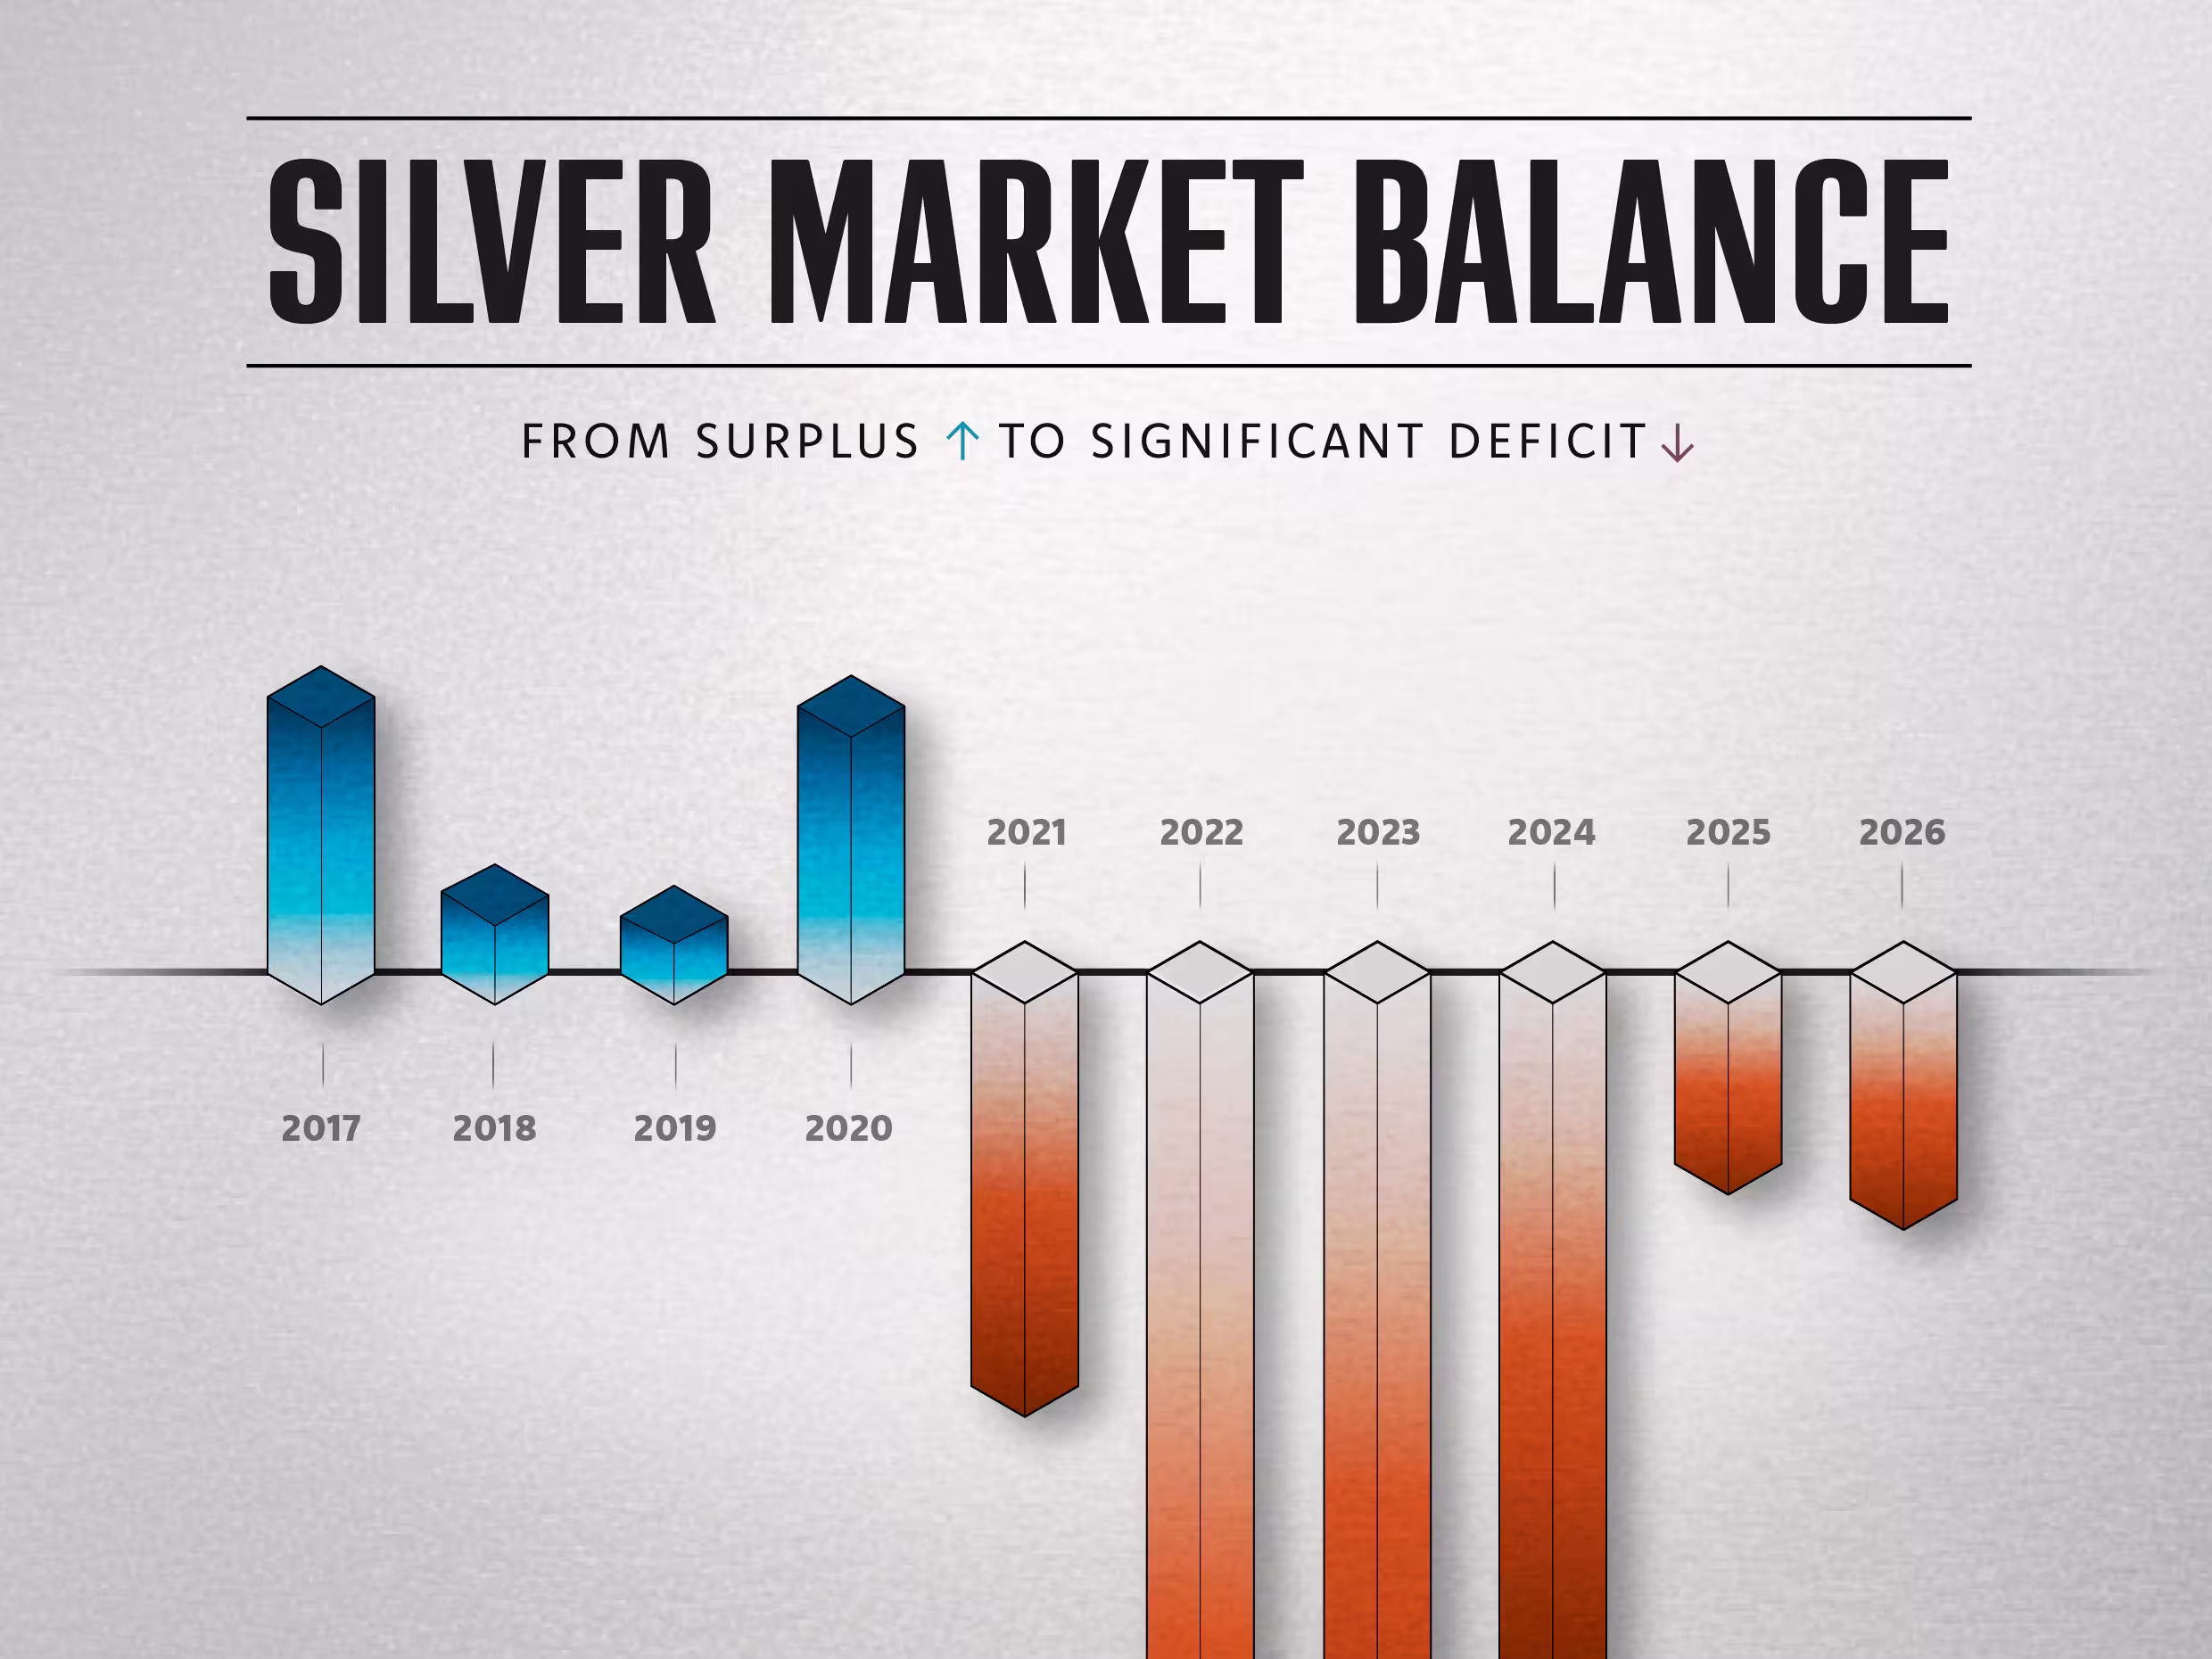
This graphic, based on data from the Silver Institute's World Silver Survey 2024, illustrates the connection between changes in silver supply, demand, and market prices. Between 2015 and 2024, the global silver market transitioned from balanced periods to pronounced supply deficits, primarily driven by rising industrial demand and stagnating mine production. This shift has significantly influenced silver prices, which have risen alongside deepening deficits.
Silver Market Surpluses and Deficits
From 2015 to 2020, the market experienced small surpluses, such as 55 million ounces in 2016, keeping prices stable at $14–$17 per ounce. However, starting in 2021, the market shifted into a deficit of 95 million ounces, expanding to 264 million ounces by 2022 due to growing demand from electronics, solar energy, and electric vehicles. In 2023, the deficit was 184 million ounces, with a projected 215 million-ounce shortfall in 2024, driven by rising demand and a slight drop in supply.
Price-Deficit Correlation
Between 2015 and 2018, silver prices remained stable, ranging from $14 to $17 per ounce due to market surpluses. Prices began climbing between 2019 and 2020, surpassing $20 per ounce by 2020 as demand increased and supply disruptions emerged. From 2021 to 2022, prices averaged between $22 and $25 per ounce, reflecting growing supply deficits. In 2023, prices stayed high at around $23 per ounce. However, in 2024, prices have surged as high as $34.9 per ounce due to continued deficits.
Industry Demand and Market Outlook
Rising demand from sectors such as solar energy and stagnating mine production have led to growing silver deficits, driving prices higher. This structural imbalance is expected to persist, keeping prices elevated as green technology and industrial needs continue to fuel demand.