Copper
September 30, 2024
1 min
Copper

The relationship between copper consumption and global population growth from 1900 to 2023 illustrates how copper demand has evolved alongside human development, industrialization, and technological advances.
1900-1950: Industrialization and Electrification
- Population Growth: Global population grew from 1.6 billion to around 2.5 billion.
- Copper Demand: Consumption expanded from 500,000 metric tons to about 2 million metric tons annually, primarily driven by the need for electrical wiring, motors, and infrastructure like railways.
1950-2000: Post-War Expansion and Globalization
- Population Boom: The global population nearly doubled to 6.1 billion.
- Copper Use: Demand surged to about 15 million metric tons annually due to post-war economic recovery, mass infrastructure development, and the rise of consumer electronics and telecommunications.
2000-2023: The Green Energy Revolution
- Population Surge: The population grew to over 8 billion.
- Record Copper Demand: Consumption rose to over 25 million metric tons annually. Urbanization, China’s rapid industrial growth, and the global shift towards renewable energy technologies fueled this increase. Copper became essential for electric vehicles (EVs), solar panels, and wind turbines, which are critical to the decarbonization efforts.
Key Insights
- Copper’s Role: While global population increased fivefold from 1900 to 2023, copper consumption increased fiftyfold, showcasing the metal's growing significance in modern economies.
- Technological Advances: Technological innovations in electricity, communications, and green energy have driven a sharp rise in per capita copper consumption, far outpacing population growth.
As the world continues to embrace new technologies, copper's role is likely to expand further, making it a cornerstone of the global energy transition.


Explore More
View All
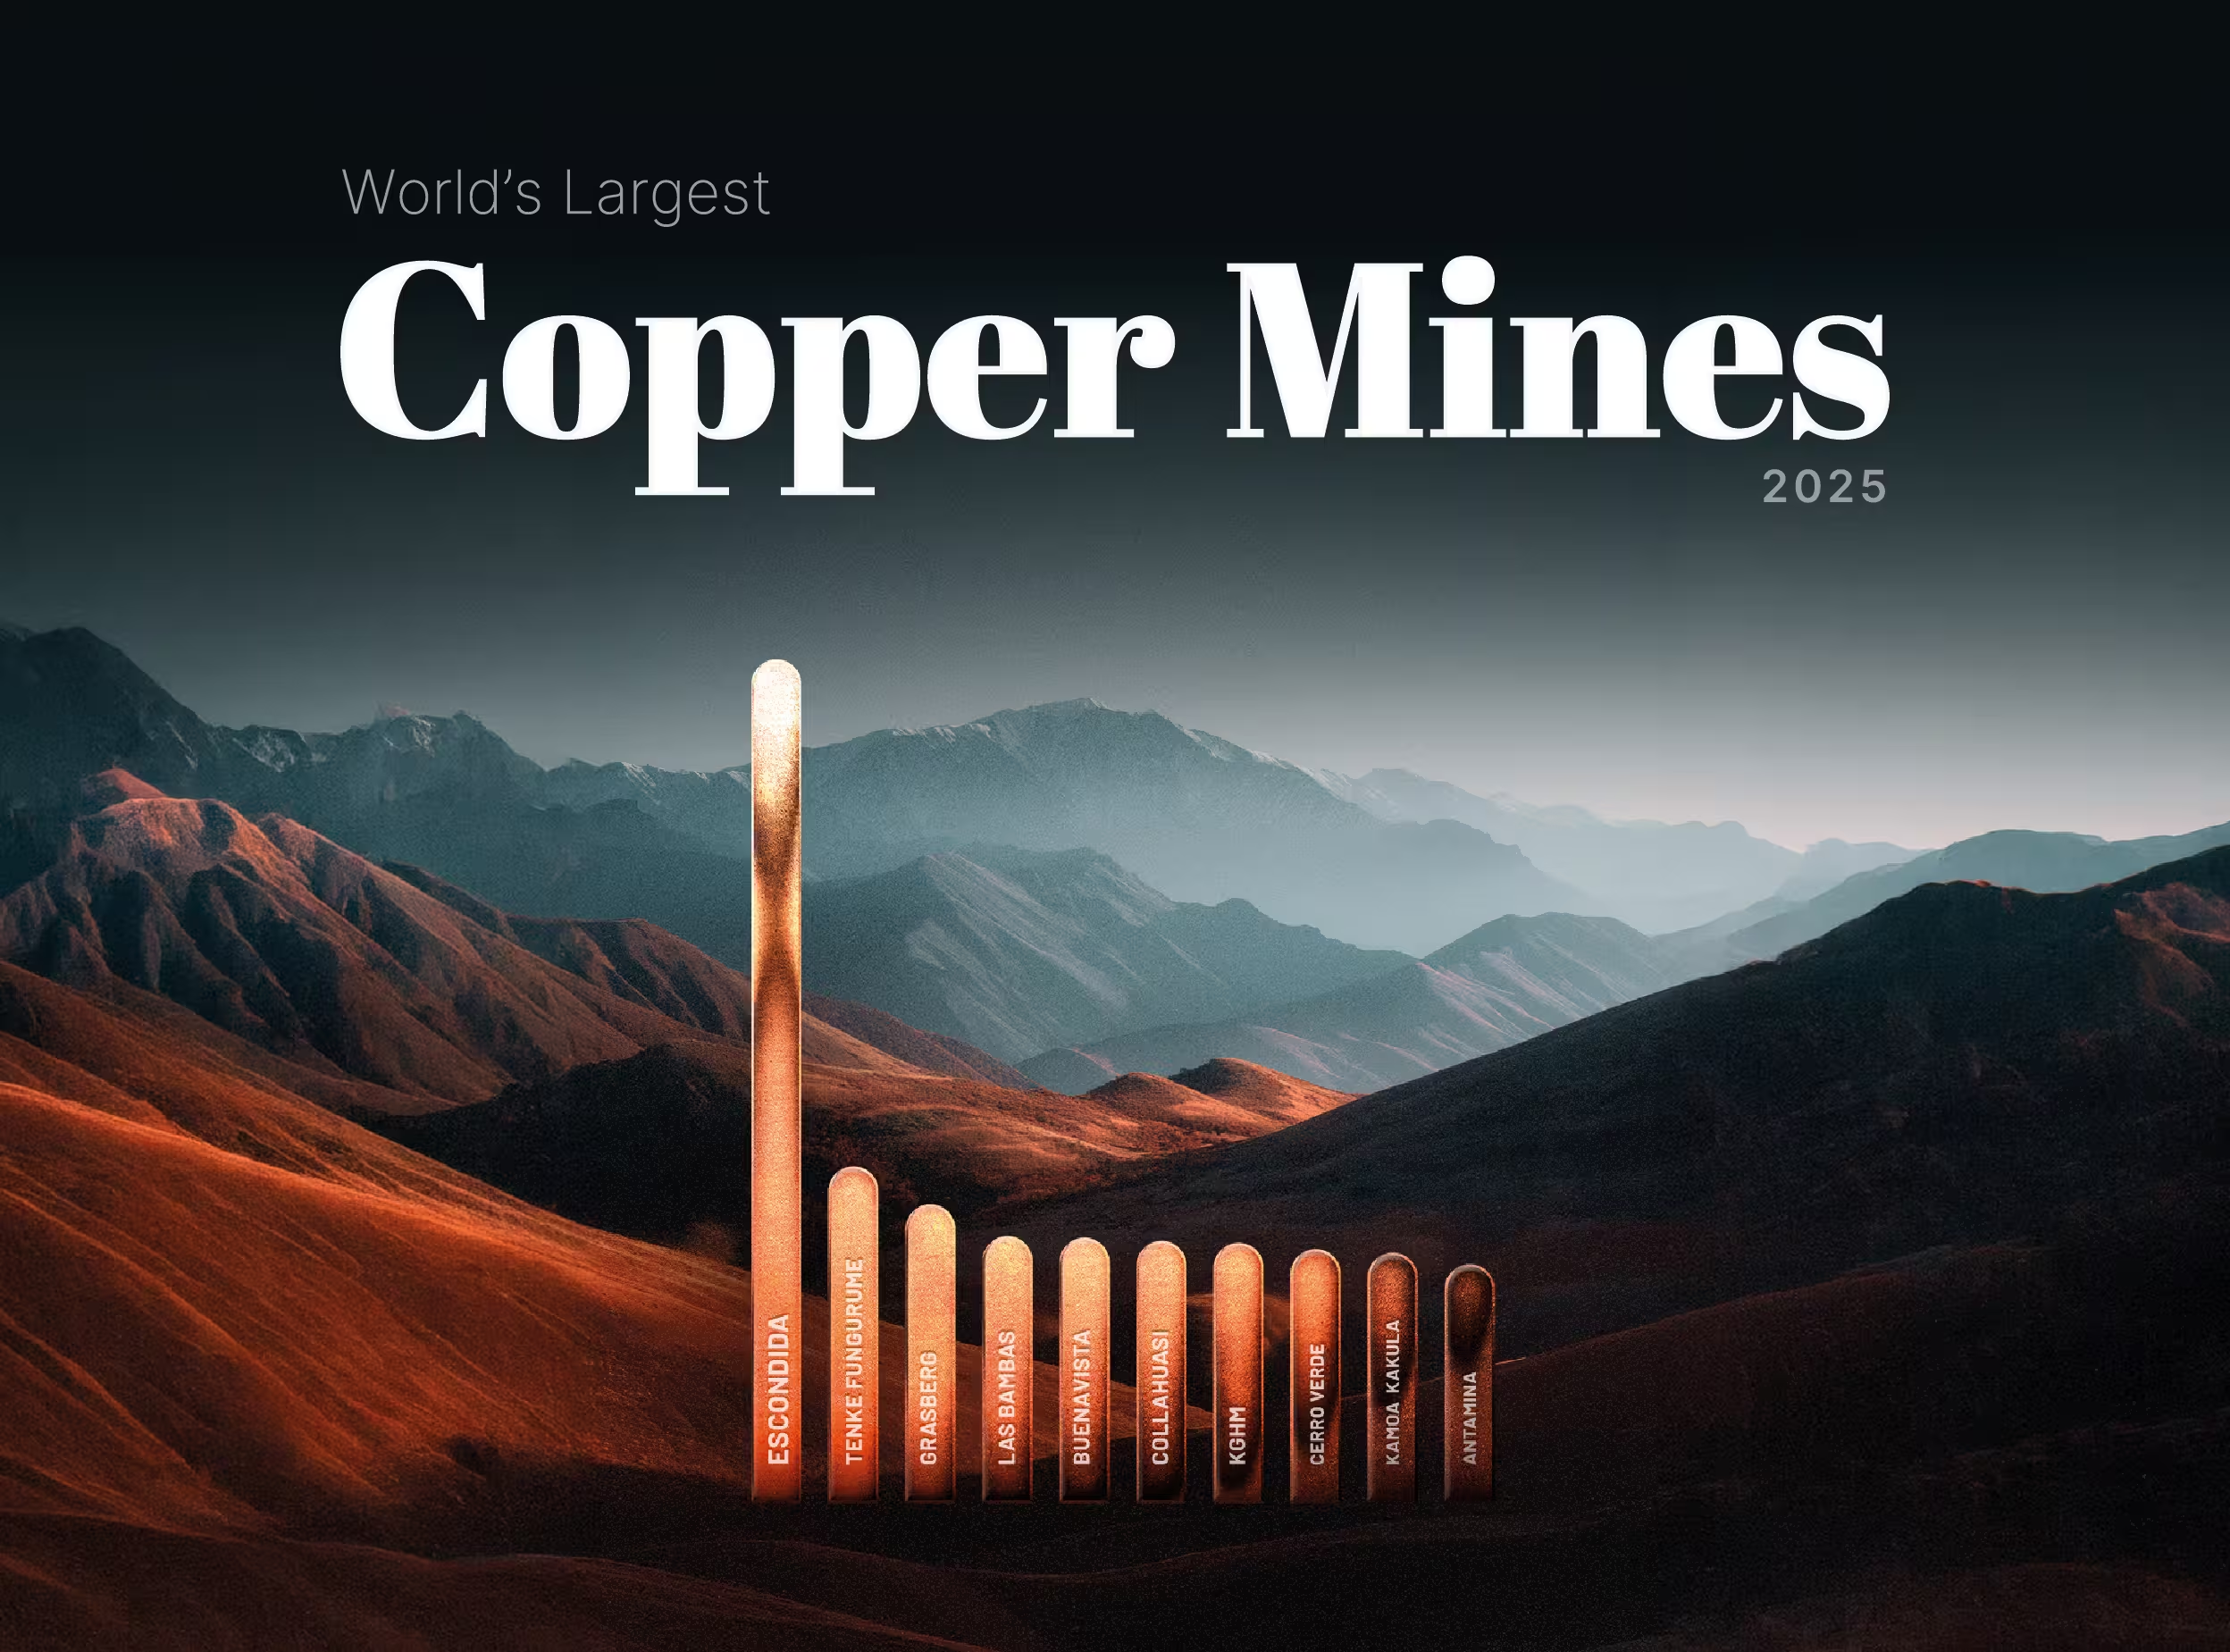
Ranked: The World's Largest Copper Mines (2025)
Ranked: The World's Largest Copper Mines (2025)
Copper has spent 2026 setting records, touching an intraday COMEX high of $6.71 per pound on May 13 amid AI-driven demand and supply shocks, against a backdrop where the ICSG now forecasts a 150,000-tonne deficit for 2026. In a market this tight, where the deficit thesis turns on lost tonnes, the question of where the world's copper actually comes from carries unusual weight.

Copper on Track for Its Highest Monthly Close on Record: A Look at the Drivers
Copper on Track for Its Highest Monthly Close on Record: A Look at the Drivers
Copper has spent most of 2026 doing something it had not done in a quarter century: setting fresh records every few weeks. The COMEX contract printed an intraday all-time high of $6.71 per pound on May 13, and the May monthly close looks set to land at the top of the historical chart. In London, copper traded above $14,000 per tonne in mid-May, touching $14,196.50, within reach of the LME's January 29 record of $14,527.50.

The Cost of Mining Copper: A 2024–2025 Update
The Cost of Mining Copper: A 2024–2025 Update
Copper futures touched an all-time high above $6.58 per pound on May 12, 2026, capping a 40.86% gain over the prior twelve months as supply tightness collided with structural demand from grid build-out, electric vehicles, and AI data centers. Earlier in the year, the LME benchmark rallied 22% to a record $13,387 per tonne on January 6, 2026. Behind the price action lies a less-discussed story: what it actually costs the world's largest miners to pull a pound of copper out of the ground.

Copper Production Q4 2025
Copper Production Q4 2025
As power-hungry AI data centers drive a projected 2-million-ton surge in global copper demand by 2030, market attention remains fixated on the supply side. Fourth-quarter 2025 metrics provide a definitive look at how the world's top miners closed out the year. While overall volumes remain heavily concentrated among a few historic industry giants, the true Q4 narratives emerged further down the list, as mid-tier producers leveraged flagship asset expansions to hit multi-year highs and offset the sector's ongoing struggle with declining ore grades.