Precious Metals
March 11, 2026
4 min
Precious Metals
%20vs.%20California%20(1848%E2%80%931898)%20thumbnail.avif)

Key takeaways
- Paradoxical Discoveries Ignited Different Eras: North Carolina's gold rush was slowly catalyzed by a massive 17-pound nugget initially used as a doorstop, whereas California's explosive migration was sparked by a microscopic 0.0855-gram flake.
- California's Yield Dwarfed North Carolina's Output: While North Carolina's local, agrarian workforce produced roughly 1.2 million troy ounces over 50 years, California drew 300,000 prospectors and yielded 12 million ounces in its first five years.
- North Carolina Built the Blueprint California Scaled: North Carolina pioneered American hard-rock mining and early mints. California later adopted these techniques to extract wealth that drastically expanded the global money supply and financed the Transcontinental Railroad.
America’s resource extraction history hinges on two gold rushes with practically paradoxical origins. The first began in 1799 in North Carolina when a 12-year-old boy found a massive 17-pound gold nugget. Ignorant of its value, his farming family used it as a doorstop for three years before selling the $3,600 rock for a mere $3.50. Conversely, the 1848 California Gold Rush—the most economically explosive in history—was sparked by a microscopic 0.0855-gram flake found at Sutter’s Mill.
North Carolina’s massive nugget launched a slow, agrarian-based mining era, while California’s tiny flake ignited a frantic global migration. To compare these eras accurately without the distortion of historical inflation, we must measure output by physical weight: the troy ounce.
Geology and Technological Evolution
The Carolina Gold Belt featured shallow placer (stream) deposits easily worked by part-time farmers and enslaved laborers during agricultural off-seasons. When these surface deposits depleted by the 1820s, North Carolina pioneered American hard-rock (lode) mining. Capital flowed in, and experienced Cornish engineers were brought over to extract gold from underground quartz veins using heavy machinery.
California’s Sierra Nevada held wealth on an entirely different scale. While it also contained deep hard-rock veins (the Mother Lode), its defining feature was an astronomical volume of pulverized placer gold embedded in modern and ancient riverbeds. When California’s surface placers depleted, miners utilized the engineering expertise brought over by veteran Carolina prospectors. They scaled this technology up drastically, inventing hydraulic mining to blast entire mountainsides with high-pressure water cannons.
Production and Demographic Scale
North Carolina's rush was a locally integrated monopoly. At its peak, it produced roughly 50,000 troy ounces annually, totaling about 1.2 million ounces over its primary 50-year run.
In stark contrast, California triggered a demographic explosion, drawing 300,000 global prospectors by 1855. In its first five years alone, California yielded 12 million troy ounces—ten times North Carolina’s entire 50-year output.
Table 1: Comparative 50-Year Gold Yields and Characteristics
*Note: California's total historic yield through 1965 was 106.1 million ounces; the bulk of this was recovered in the fifty-year period spanning 1848–1898.
Chart 1: Estimated 50-Year Total Yield (Troy Ounces)
%20vs.%20California%20(1848%E2%80%931898)%20content%201.avif)
The Giant Nuggets
Because North Carolina’s gold rested in low-energy streams, it wasn't pulverized by erosion, yielding massive, smooth chunks. "Peter's Nugget" (28 lbs) remains the largest documented nugget found east of the Mississippi.
California’s aggressive glacial and riverine erosion usually ground its gold into flakes and dust. However, its immense scale still produced rare, gargantuan specimens deeper underground, such as the monstrous 195-pound Carson Hill Nugget.
Table 2: Comparative Catalog of Notable Historic Nuggets
Chart 2: Comparative Weights of Historic Nuggets (Troy Ounces)
%20vs.%20California%20(1848%E2%80%931898)%20content%202.avif)
Macroeconomic Legacy
Both rushes permanently altered the US economy. North Carolina's output necessitated the creation of early private mints and the first federal branch mints in the South, firmly anchoring the young nation to a gold standard.
California’s unprecedented historical yield drastically expanded the global money supply, fast-tracked California’s statehood, financed the Transcontinental Railroad, and provided crucial economic stability to the Union during the Civil War. Ultimately, North Carolina provided the mechanical and financial blueprint, while California applied it on a globally disruptive scale.
Disclaimer & Sources
Disclaimer: The content provided on MiningVisuals is for educational and informational purposes only and does not constitute financial or investment advice. Always conduct your own due diligence and consult with a licensed financial advisor before making any investment decisions. Past performance is not indicative of future results.
- California State Parks. (n.d.). California State Mining and Mineral Museum. State of California. Retrieved March 11, 2026, from https://www.parks.ca.gov/?page_id=588
- Clark, W. B. (1970). Gold districts of California (Bulletin 193). California Division of Mines and Geology. https://www.conservation.ca.gov/cgs/documents/publications/bulletins/B_193.pdf
- Koschmann, A. H., & Bergendahl, M. H. (1968). Principal gold-producing districts of the United States (U.S. Geological Survey Professional Paper 610). U.S. Department of the Interior. https://pubs.usgs.gov/pp/0610/report.pdf
- North Carolina Department of Natural and Cultural Resources. (n.d.). History of Reed Gold Mine. North Carolina Historic Sites. Retrieved March 11, 2026, from https://historicsites.nc.gov/all-sites/reed-gold-mine/history
- Sierra County Historical Society. (n.d.). The Monumental nugget. Sierra County History. Retrieved March 11, 2026, from https://www.sierracountyhistory.org/monumental-nugget
- Smithsonian Institution. (n.d.). Gold flake, Sutter's Mill, 1848. National Museum of American History. https://siarchives.si.edu/collections/siris_sic_9946
- United States Congress. (1834). Coinage Act of 1834 (4 Stat. 699). U.S. Government Publishing Office.





Explore More
View All


Gold's Record Run Has Set Off a Wave of Mining Mergers
Gold's Record Run Has Set Off a Wave of Mining Mergers
Gold hit an all-time high of about US$5,595 an ounce in January 2026 before settling near US$4,000, still far above the levels of a few years ago. That combination, record prices followed by a stable, still-profitable pullback, has done something a straight rally rarely does: it has opened a merger window.
.webp)
Three Ancient Belts Carry Ghana's Gold, and Investment Keeps Flowing to Them
Three Ancient Belts Carry Ghana's Gold, and Investment Keeps Flowing to Them
In March 2026, one of Ghana's own mining companies said it would invest about $1.2 billion in its operations at the Tarkwa and Damang gold mines. Both sit on the Ashanti belt, one of three narrow bands of ancient rock that carry almost all of Ghana's gold.
Charted: Fifty Years of Gold Production in West Africa
Charted: Fifty Years of Gold Production in West Africa
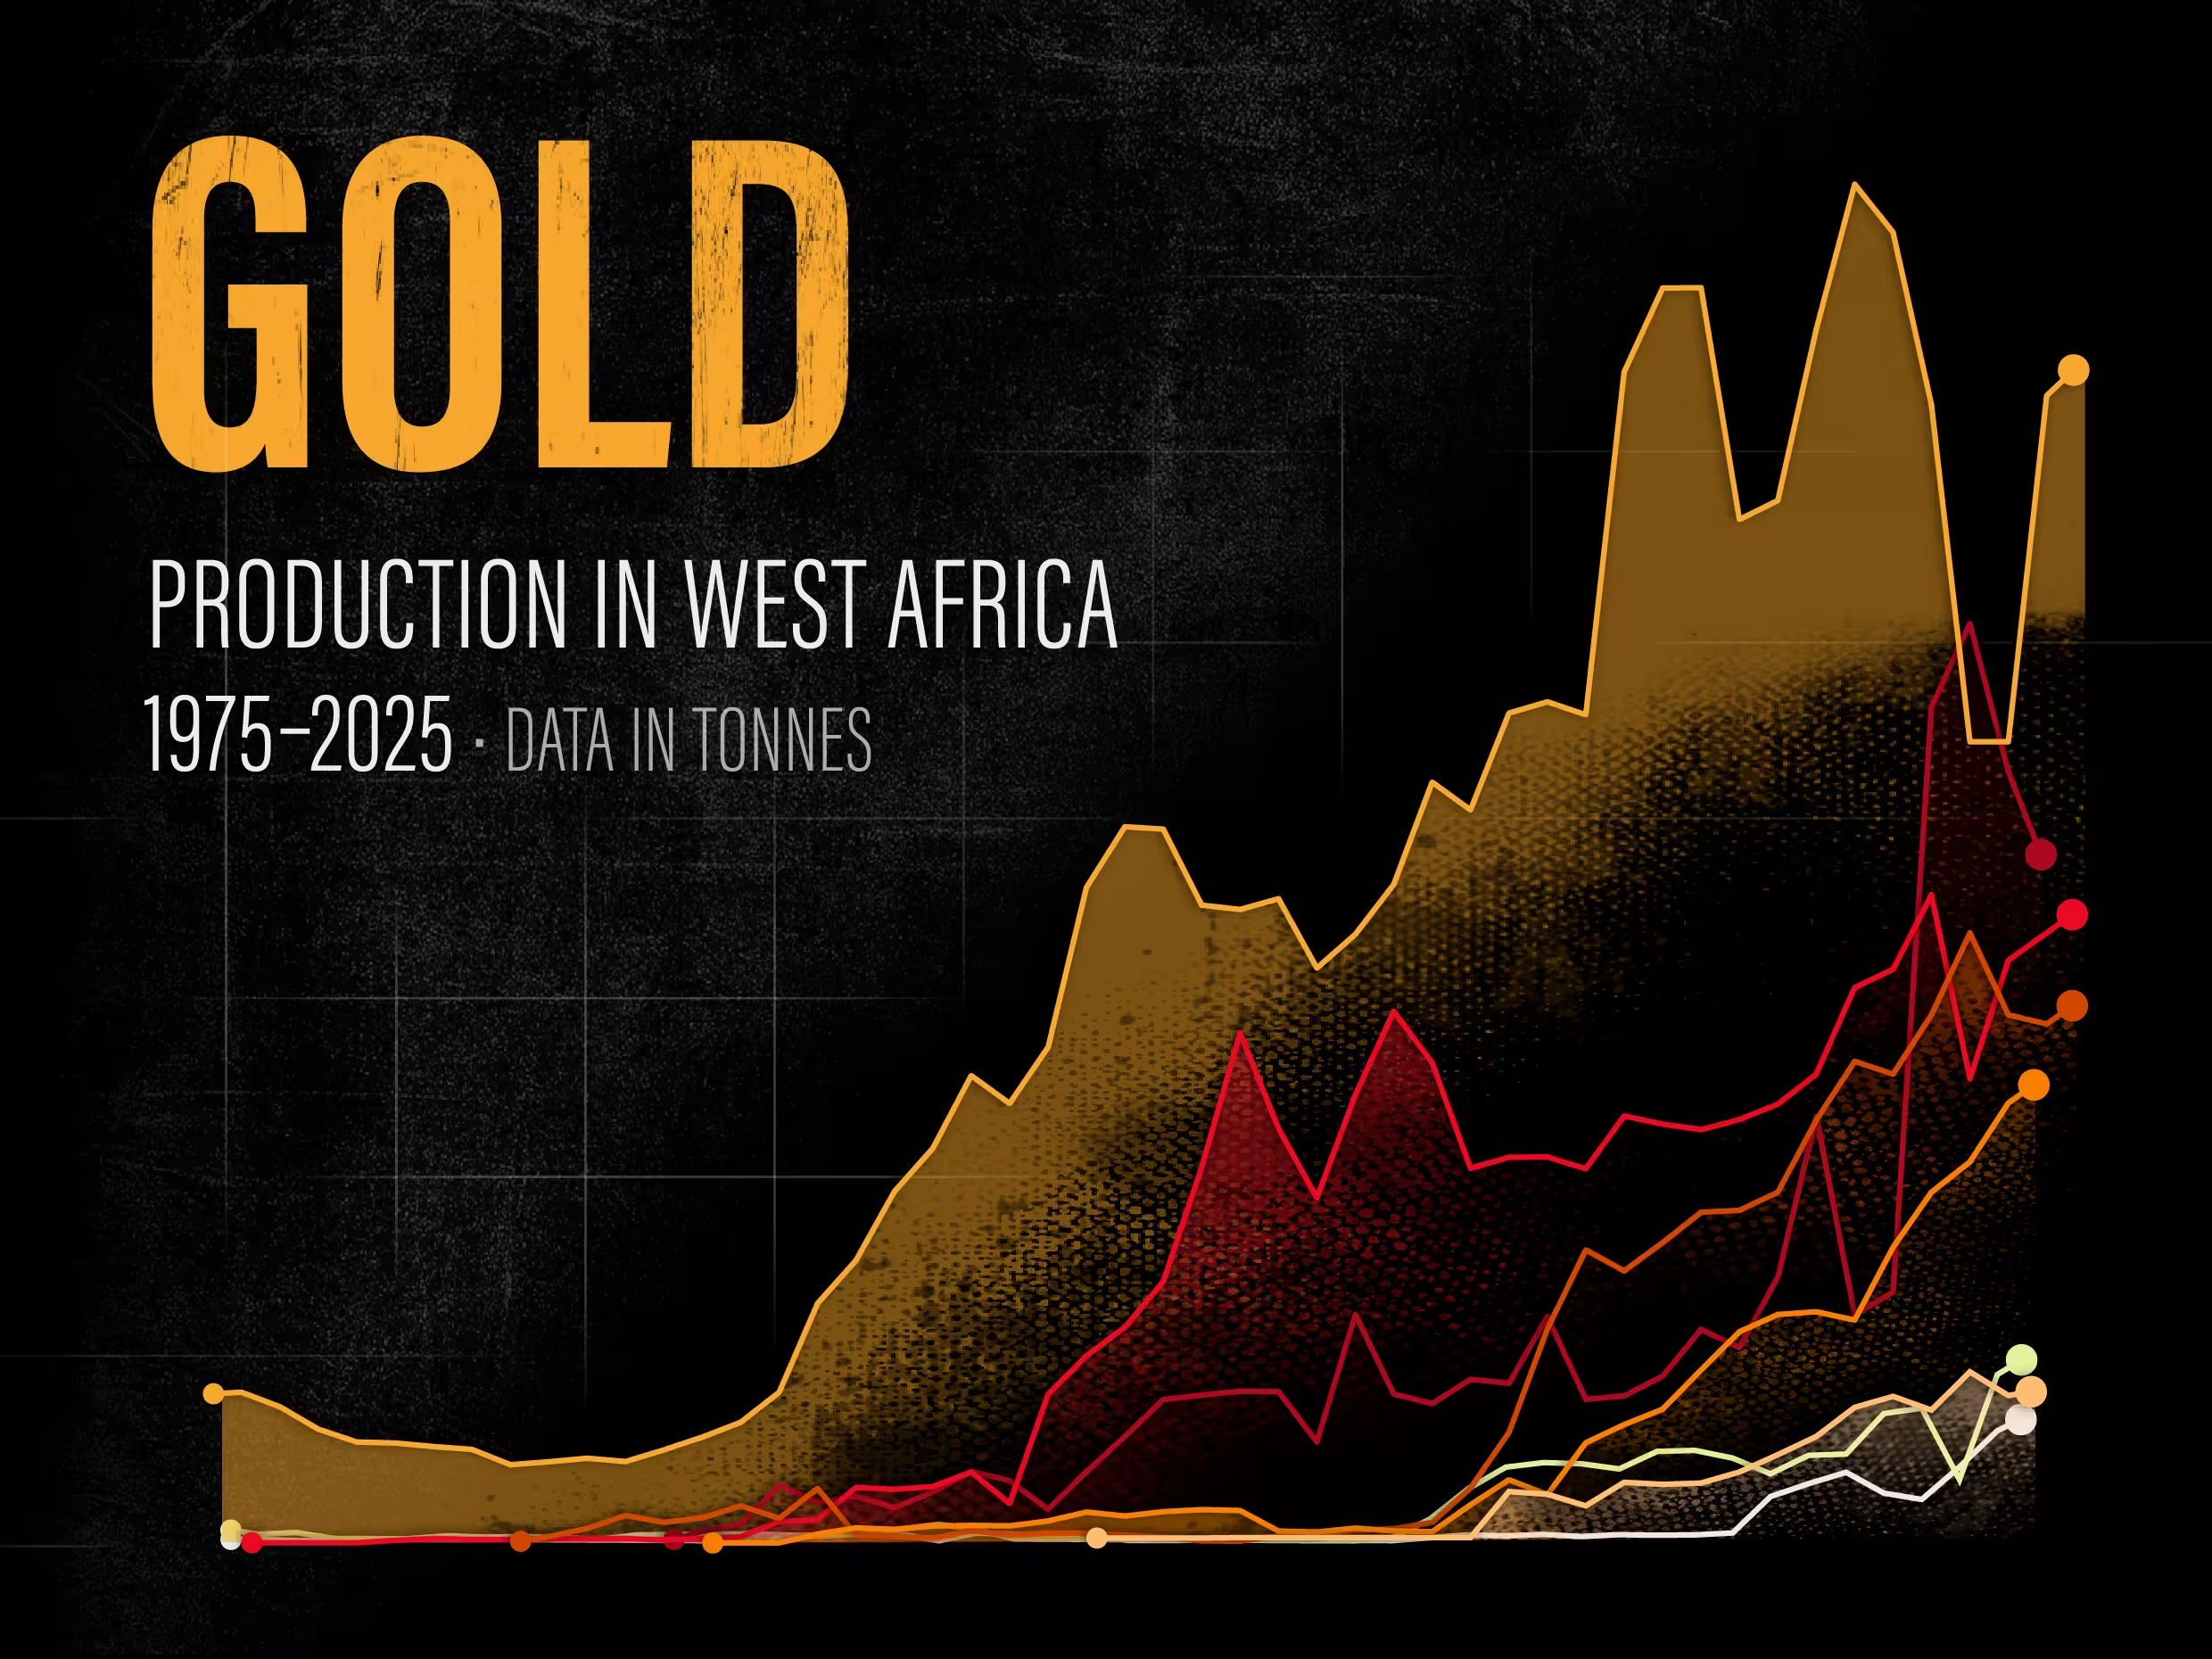
West Africa is in the middle of a gold run. In 2025 Ghana's output climbed more than 23 percent to a record 5.94 million ounces, holding its place as Africa's largest producer and now the sixth-largest in the world, and analysts expect the wider region to rebound about 8 percent in 2026.
Ghana's Gold Mining Landscape: A Story Written in Ancient Rock
Ghana's Gold Mining Landscape: A Story Written in Ancient Rock
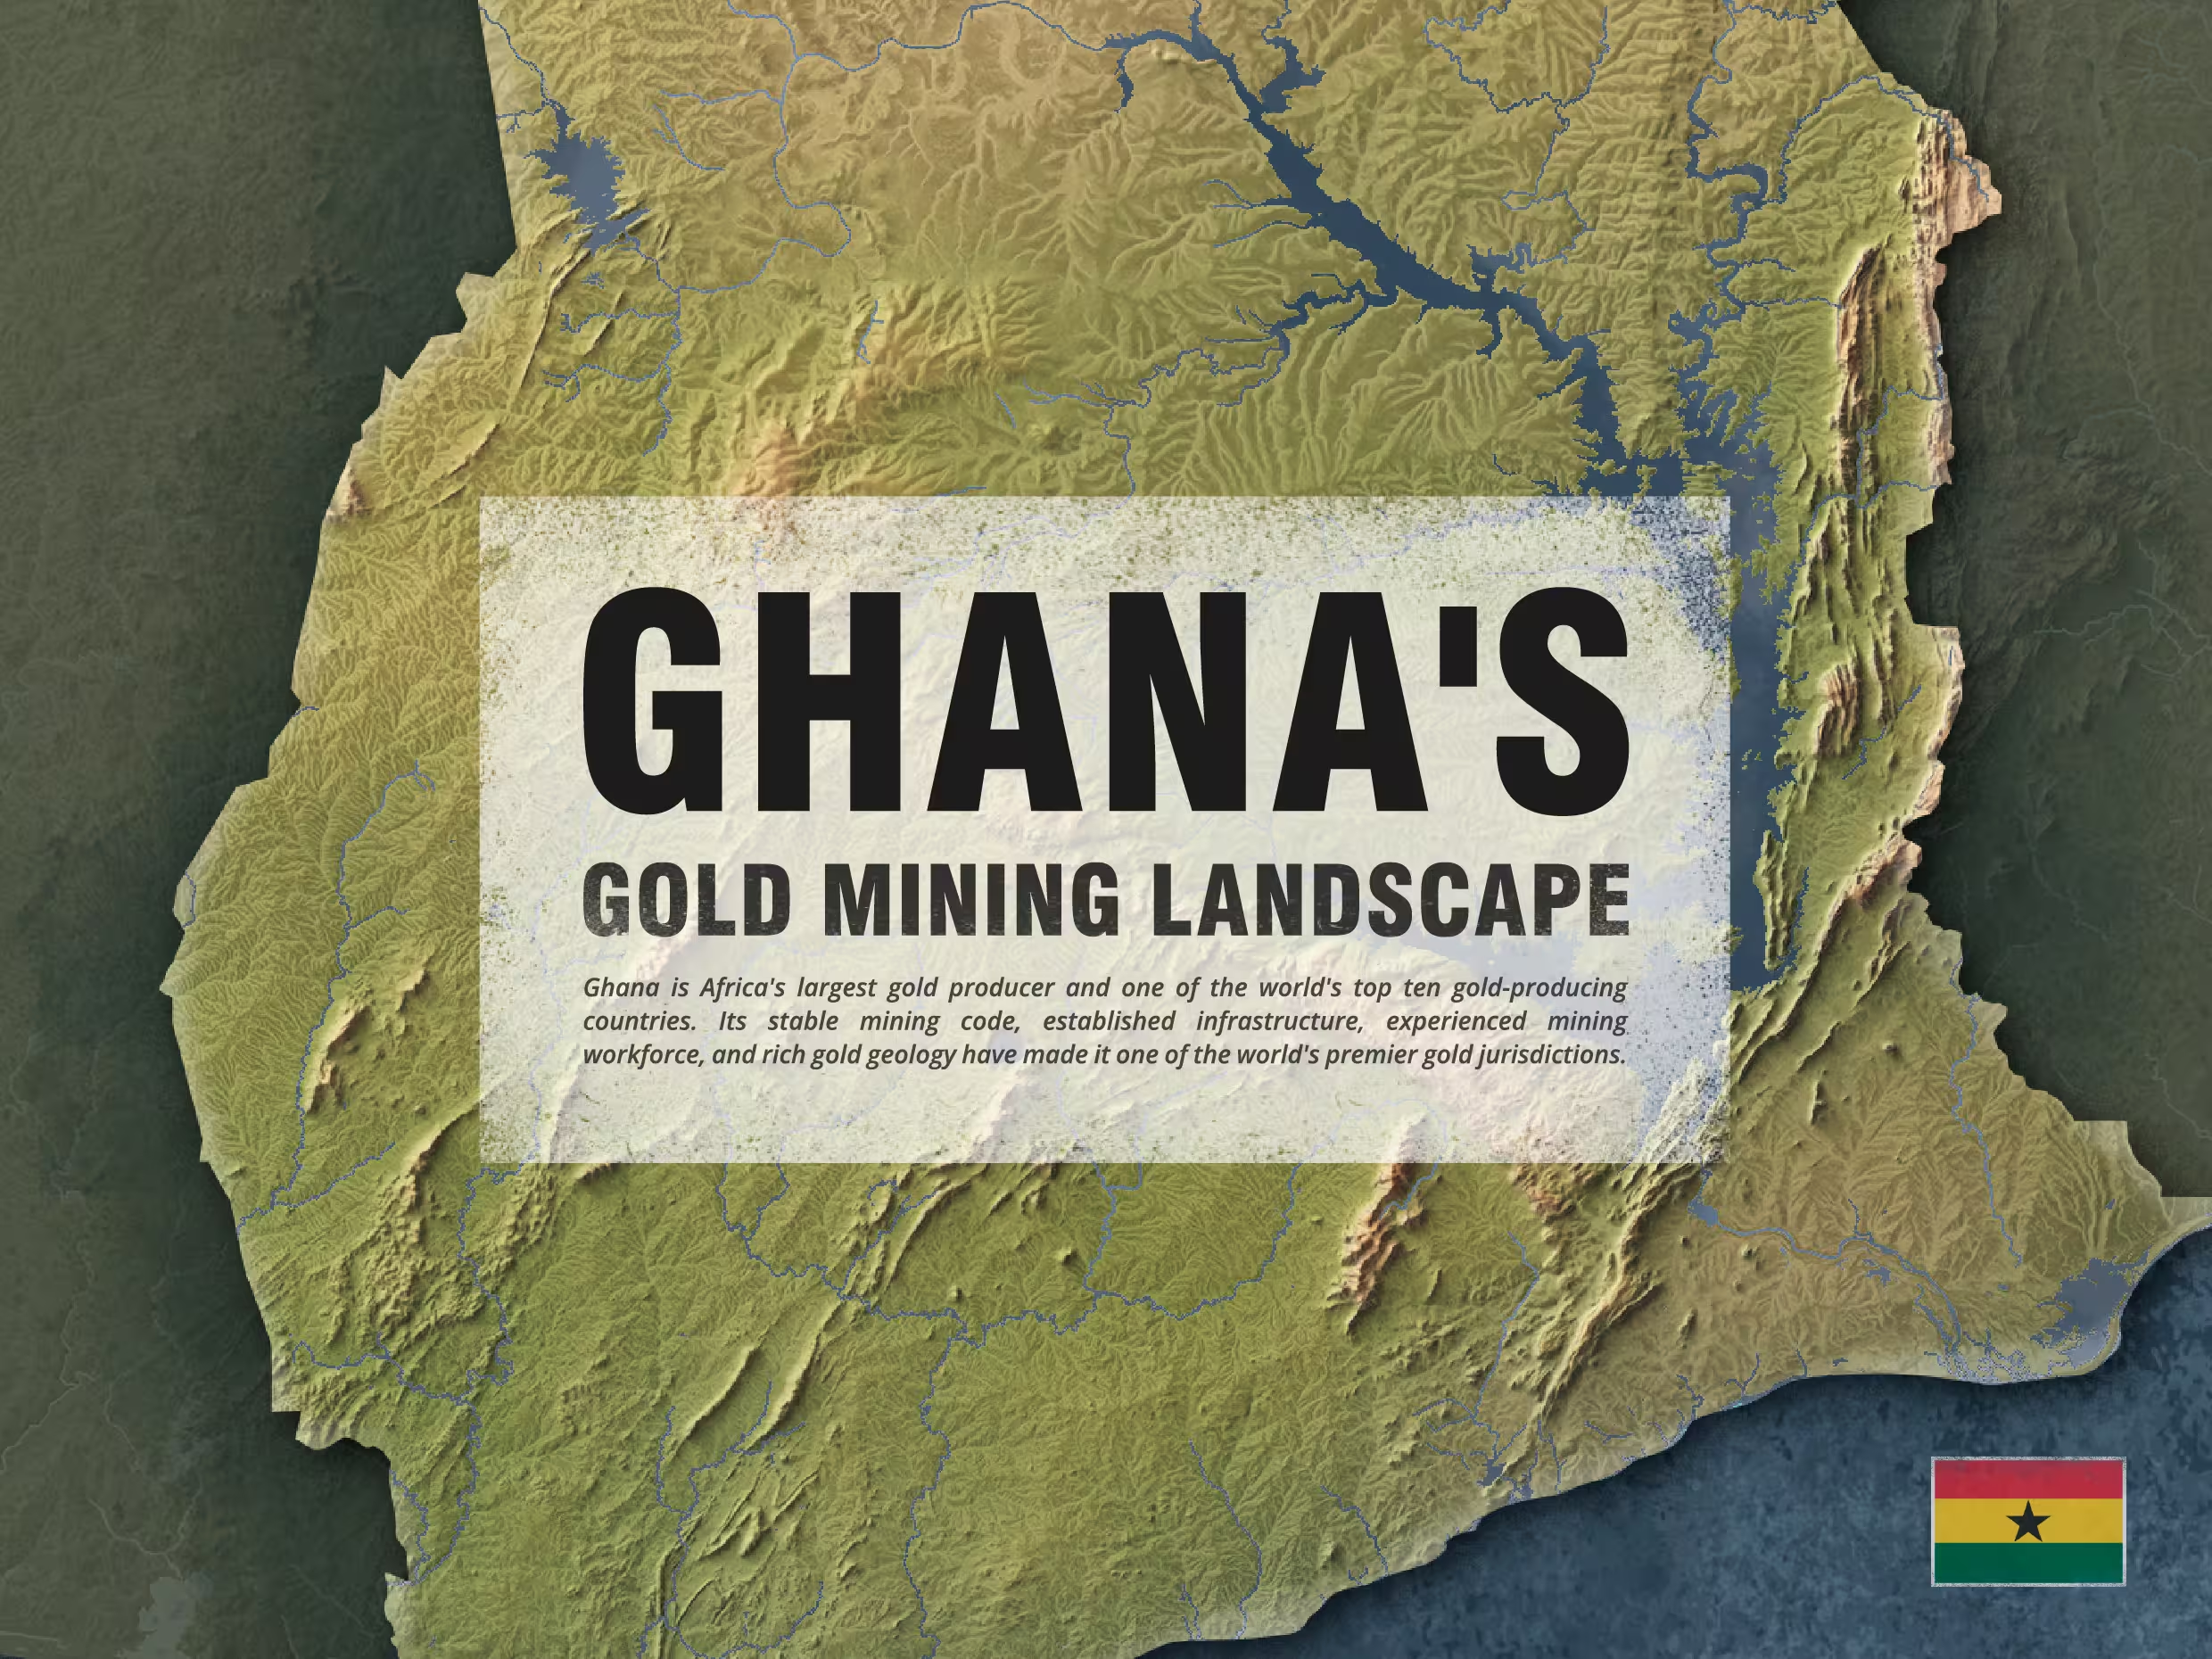
Ghana is one of the world's most significant gold-producing countries, and in 2025 it remained the largest in Africa, with national output reaching about 6 million ounces. But the numbers are only the surface. Ghana's gold reaches back more than two billion years into the rock beneath it, shaped by ancient mountain-building forces and worked by human hands for well over a century.