Precious Metals
December 29, 2025
3 min
Precious Metals
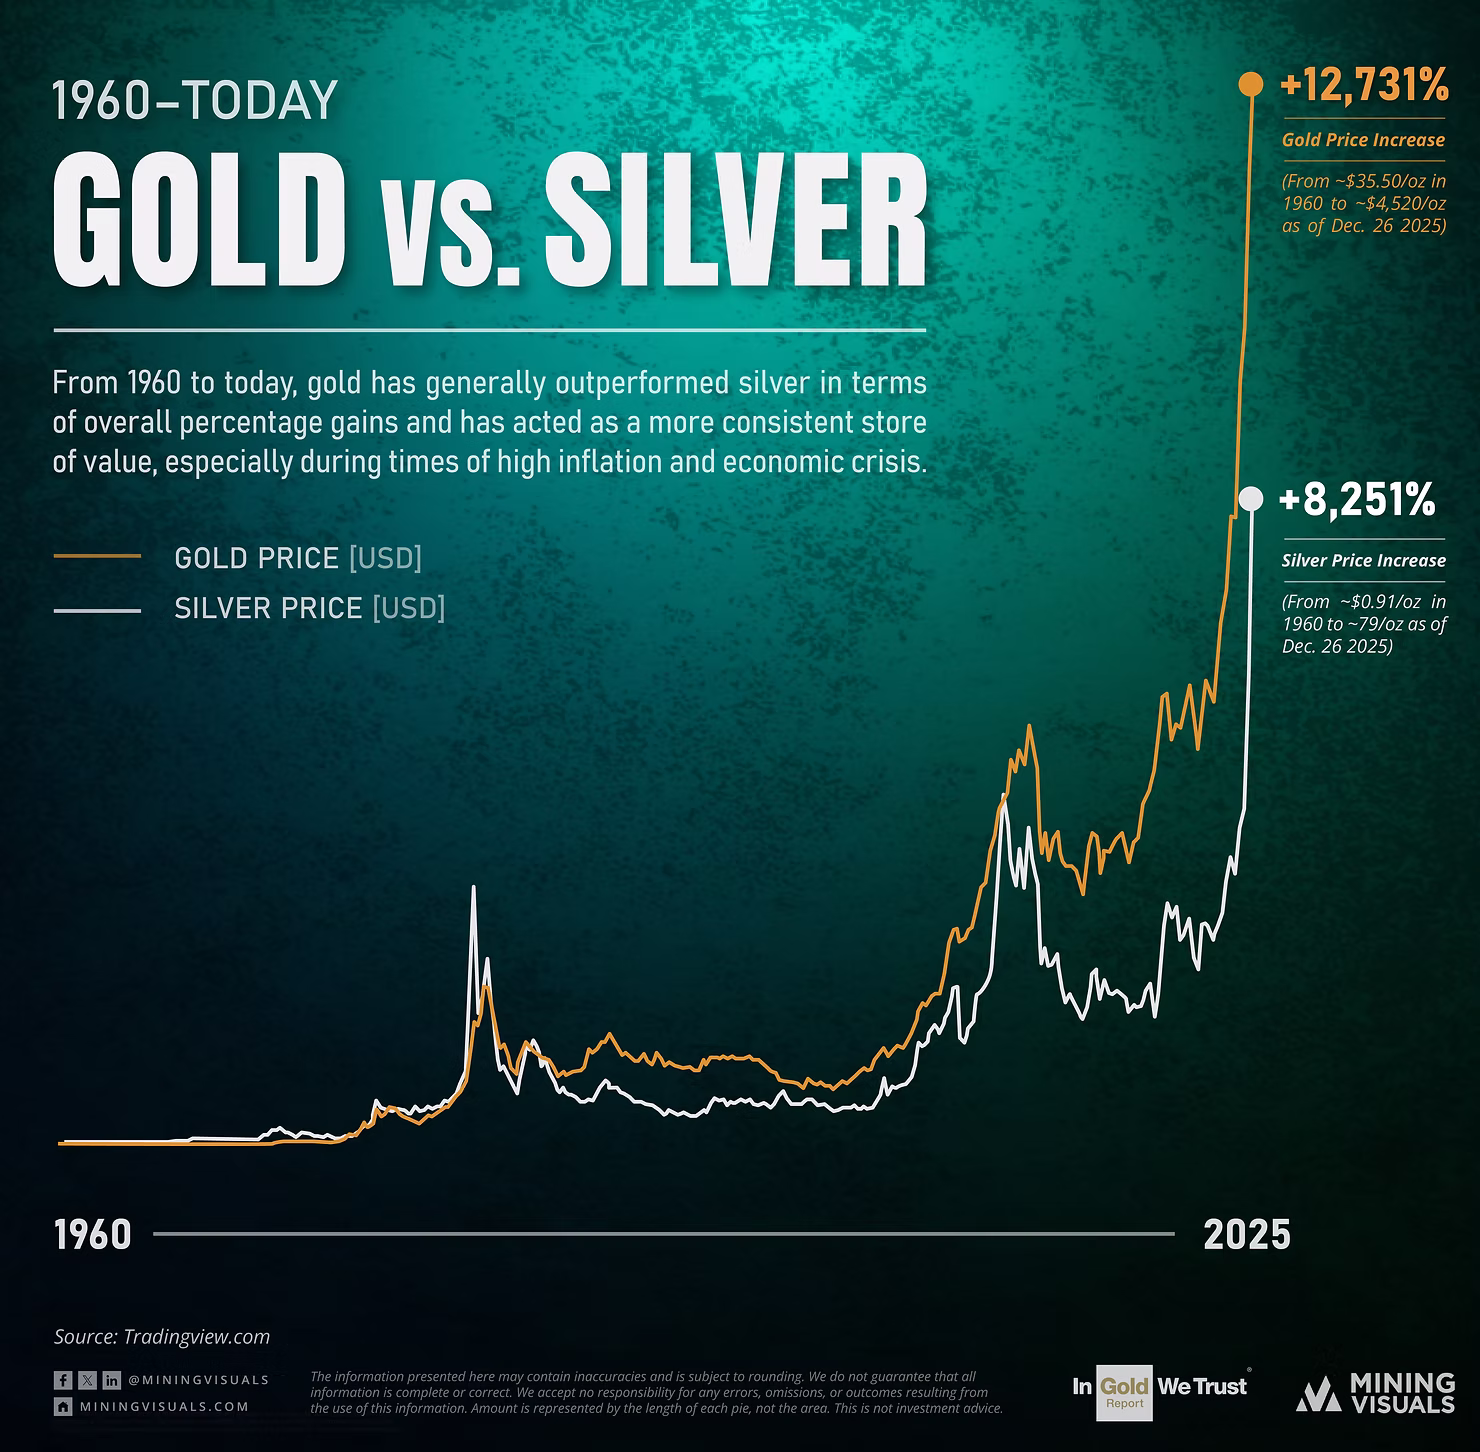
The chart above tracks 65 years of price history, but the most compelling story isn't just the long-term trend, it’s the explosive price action happening right now.
After decades of steady accumulation, the "Yellow Metal" has entered a new phase of price discovery, leaving historical resistance levels in the dust. Meanwhile, Silver is waking up, displaying its signature volatility as it attempts to close the gap.
1. Gold: The Breakout (Technical Strength)
Gold’s recent price action (the orange line) is defined by higher lows and shattered ceilings. Unlike previous cycles where gold would spike and retrace 30-40%, the recent trend shows aggressive buying on dips. The chart shows a "parabolic" move emerging in the 2020s, signaling that gold has transitioned from a passive hedge to a momentum trade. It is no longer just protecting wealth; it is aggressively repricing it.
2. Silver: The Slingshot Effect
For decades, Silver (the white line) was haunted by the "Double Top" of 1980 and 2011, where rallies failed at the $50 mark. The chart reveals that this era is over. Silver didn't just inch past its old highs, it vaulted over them. This confirms a massive structural shift: the market has finally absorbed the "byproduct supply" glut, and speculative money has returned to the silver market with force.
The Catalysts: What is Driving the Recent Vertical Move?
Why is the chart going vertical now? Three specific market drivers are fueling this latest leg up:
- The Geopolitical Premium: With conflicts escalating in Eastern Europe and the Middle East, the "Fear Trade" is back. Capital is fleeing risk assets and moving into physical metals, creating a price floor that didn't exist a decade ago.
- The Central Bank "Whales": This is the biggest change in the market. Since 2022, global central banks (led by China, Poland, and Singapore) have been buying gold at record paces. They are not price-sensitive; they are buying to diversify away from the dollar, creating immense sustained demand.
- The Rate Cut Narrative: As markets anticipate the end of the high-interest-rate cycle, speculators are front-running the Fed. Lower rates typically weaken the dollar, acting as rocket fuel for precious metals prices.
The Bottom Line
The chart shows a clear breakout. Gold has decoupled from traditional correlations and is carving a new path upward, driven by sovereign buying and geopolitical stress. Silver remains the wild card, lagging behind, but with the historical potential to outperform rapidly if the "catch-up" trade ignites.
Sources & Data
- 1960 Historical Prices: Historical spot price data for 1960 (Gold ~$35.50; Silver ~$0.91) via OnlyGold and MeasuringWorth.
- 2025 Market Data: Current spot prices (Gold ~$4,520; Silver ~$79) as of Dec 26, 2025, via TradingView.
- Silver Supply Dynamics: Data on silver byproduct supply (approx. 70-80% of global output) via The Silver Institute (World Silver Survey) and USGS Mineral Commodity Summaries.
- Industrial Demand: Silver industrial offtake statistics (~50%+ of demand) via The Silver Institute.
- Central Bank Buying: Sovereign gold purchase trends (2022–2025) via World Gold Council (Gold Demand Trends).
Disclaimer: This content is for informational purposes only and is not investment advice. Precious metals are volatile, and past performance does not guarantee future results.


Explore More
View All
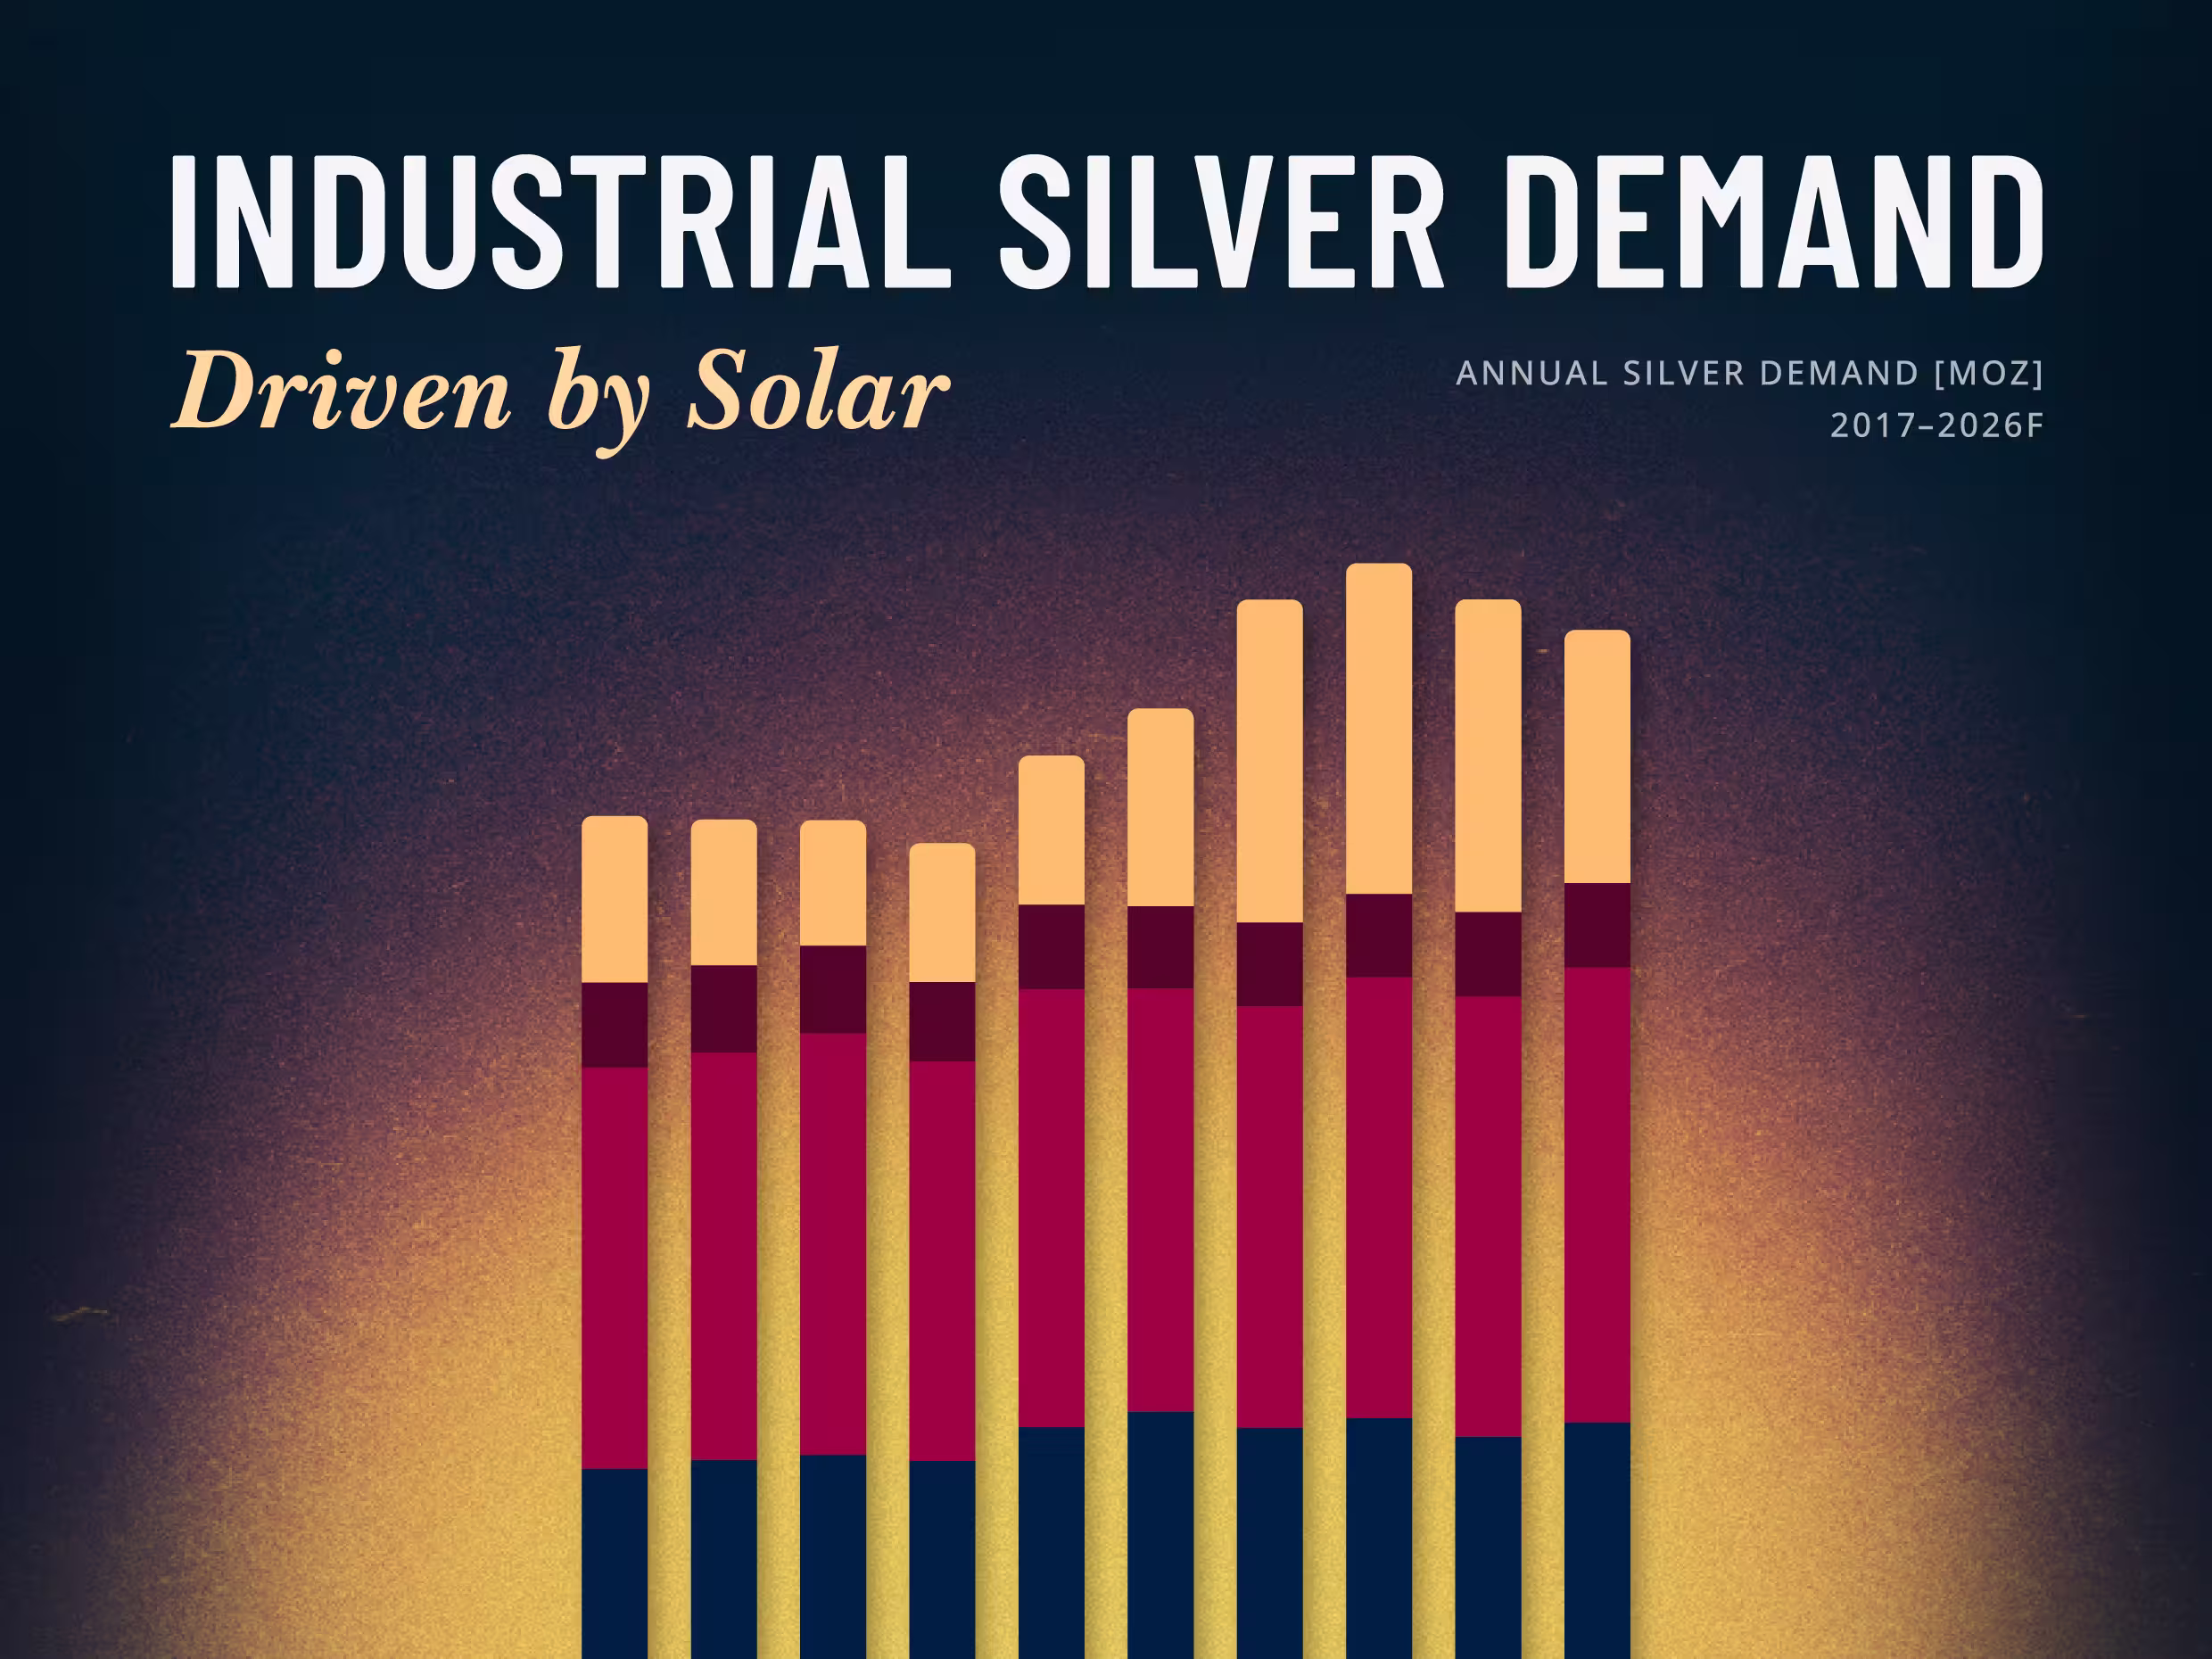
Solar Is Silver's Largest Industrial Market, and Not Easily Replaced
Solar Is Silver's Largest Industrial Market, and Not Easily Replaced
When LONGi Green Energy, the world's largest solar module maker, told investors on January 5, 2026 that it would begin mass-producing base-metal solar cells in the second quarter, it put a number on a pressure the whole industry feels. Solar is the largest single application within silver's industrial demand, and as the metal ran to a record above $121 an ounce in January, rising silver costs pushed manufacturers to accelerate efforts to reduce the metal per cell.

Silver in the Data Center: How AI's Power Crunch Is Building a New Pillar of Industrial Demand
Silver in the Data Center: How AI's Power Crunch Is Building a New Pillar of Industrial Demand
In early 2026, the artificial intelligence narrative shifted abruptly from software capabilities to physical hardware constraints. With tech giants committing hundreds of billions to new infrastructure—pushing global hyperscaler capital expenditures past $600 billion this year—the industry has collided with a new primary bottleneck: a severe power and thermal crunch.

Silver's Use Cases: A Visual Guide to Where the Metal Actually Goes
Silver's Use Cases: A Visual Guide to Where the Metal Actually Goes
Somewhere inside a pressurized-water reactor, an alloy that is four-fifths silver is absorbing neutrons to keep the core in check, a job most silver investors have never heard of. It is a useful reminder that the metal people picture as coins and jewelry mostly works elsewhere, across industry.

Ranked: The Countries That Produced the Most Silver in 2025
Ranked: The Countries That Produced the Most Silver in 2025
Mexico remained the world's top silver-producing country in 2025, mining 172.9 million ounces (Moz), roughly a fifth of global supply, according to the World Silver Survey 2026, produced for the Silver Institute by Metals Focus. But Mexico's lead narrowed: its output fell 5% for a third straight year, while second-place Peru climbed 7%. Global mine production rose 3% to 846.6 Moz, even as the ranking's top tier told a story of one leader sliding and its closest rival closing in.